Friday, August 31, 2007

Tipping Point? and the Long View for Discussion this Long Weekend


The above chart represents the price of a Greater Vancouver Single Family Home adjusted for quality and inflation from 1975 to present. The chart clearly shows periods of wild price appreciation and periods of price declines. The average is indicated by the black trend line representing a rough 'fundamental' value for homes in the market. If values were to retreat to the black line either through price declines or high inflation it would bring the price of a benchmark home down nearly 25%. In past price declines, the benchmark has lost value bringing it far below the trend line.

The question for the weekend is:

In recognition that bubbles are inflated and deflated with psychology, have we reached the sociological tipping point in Vancouver surrounding our lurid affair with real estate values? Have we now recognized the error of our ways and are now contemplating confession? Will we look up to realize we have been staring in the mirror while the world falls apart around us? Are we ready to atone for our bubble misdeeds? The hard work in paying off that 40 year, 100% financed Whalley condo looks pretty unappealing at this point.

Case in point, I heard the 'business analyst' Michael Levy on CKNW radio this morning say that we will have a real estate correction in Canada. Previous to this reference I have not heard, aside from Victor Adair, any of the local business talking heads mention this as a possibility.

More abnormally, I also heard the sportscaster Neil McRae reference a 'so-called bubble in real estate' when discussing BC Lion's Lui Pasaglia decision to leave sports and help in his family's development company, which is developing some properties in Port Coquitlam. The station obviously has some vested interests as nearly every commercial aired on CKNW is for real estate or mortgage products.

I'll be glad when we can hear other commercials again!

Thursday, August 30, 2007

CMHC Data Update

I received the August Housing Now report yesterday from the Canada Mortgage and Housing Corporation for the Vancouver and Abbotsford Census Metro Areas. The report covers housing starts, units under construction, and completions for these areas during the month of July 2007.

Starts were 1524, which is down significantly from July 2006 at 2163 but the starts series is highly volatile and July 2006 was a higher than average month.


Completions were average with 1534 new housing unit completions in the month of July.


There is still a near record number of units under construction in the Vancouver area right now at 21941. Starts have really come off their rolling 12 month highs during 2006.


On another note, I have noticed a recent trend with the completions numbers that CMHC publishes. They publish two separate completion numbers: 1) Completed and Absorbed and 2) Completed and Not Absorbed. The "Completed and Not Absorbed" count has risen by 48.4% from last July. There are currently 1083 new housing units for sale (Up from 730 in July 2006) that nobody apparently wants to buy. I wonder why?

And just to emphasize my point for clarity. Who the heck is going to buy all of these new units? If existing residents buy them then who will buy their house?

Population growth is anemic and current building levels are unsustainable without population growth. Who wants to move here with these high housing prices?

Props to VHB for the head start on the charts.

Tuesday, August 28, 2007

Home Prices: Steepest Drop in 20 Years

By Vinnee Tong, AP Business Writer
S&P Says Housing Prices Fell in 2Q by Steepest Rate Since Its Index Was Started in 1987


NEW YORK (AP) -- U.S. home prices fell 3.2 percent in the second quarter, the steepest rate of decline since Standard & Poor's began its nationwide housing index in 1987, the research group said Tuesday.

The decline in home prices around the nation shows no evidence of a market recovery anytime soon, one of the architects of the index said.

MacroMarkets LLC Chief Economist Robert Shiller said the declining residential real estate market "shows no signs of slowing down."

The report came a day after the National Association of Realtors said sales of existing homes dropped for a fifth straight month in July while the number of unsold homes shot up to a record level. The S&P/Case-Schiller quarterly index tracks price trends among existing single-family homes across the nation compared with a year earlier .

A separate index that covers 20 U.S. cities fell 3.5 percent in June from a year earlier. A 10-city index fell 4.1 percent from a year earlier.

Housing is among the economic indicators closely watched by Federal Reserve policymakers. After five years of rapidly rising home prices, the market stalled last year, with prices holding steady or falling as sales slowed. Since then, lenders have made it more difficult for some people to get mortgages by tightening standards just as foreclosures rise and some who borrowed at adjustable rates facing higher payments they can't meet. Problems have spread from those with poor credit repayment histories to more creditworthy borrowers.

The Fed has taken a number of steps aimed at stabilizing the situation, and market watchers look further for a possible cut in the federal funds rate, which is the rate commercial banks charge each other for short-term loans. That rate has been kept steady at 5.25 percent for more than a year. The Fed has its next regularly scheduled meeting on Sept. 18.

Fifteen of the cities surveyed for S&P's 20-city index showed a year-over-year decline in prices in June. Prices in Boston dropped in June at a slower rate than they did in May, continuing a trend that started at the beginning of the year. In April 2006, Boston was the first metropolitan area to show a year-over-year decline, so any turnaround there could be an early sign of recovery. S&P said it needed more data to determine whether Boston would be the first area to improve.

Detroit led the cities with the biggest price declines, with an 11 percent drop from June of last year. Other cities with falling prices included Tampa, Fla., San Diego and Washington, D.C., which all recorded drops of at least 7 percent. Seattle and Charlotte, N.C., were on the small list of cities that saw prices rise in the same period. Seattle prices rose 8 percent in June while Charlotte saw a 6.8 percent increase.

In Monday's report, the National Association of Realtors said sales of existing homes dipped by 0.2 percent in July from June to a seasonally adjusted annual rate of 5.75 million units. The median price of a home sold last month slid to $230,200, down by 0.6 percent from the median price a year ago. It marked the 12th consecutive month that home prices have declined, a record stretch.

Friday, August 24, 2007

Reason for Blogging

I found this little gem over at Seattle Bubble Blog that is pretty sad in so many ways. I encourage you to listen. This is the type of situation I have hoped to help people avoid by having this blog and by working hard at my job. Finances can dramatically affect one's personal life.


Some more news to chew on over the weekend:

1) Subprime Spillover affects Canadian Mortgage Market
2) Vancouver 6th Most Overpriced City in the Whole Wide World!

Thursday, August 23, 2007

Charts are Cool!

I admit it. I have an addiction to maps and charts. I love looking at them and I love creating them. They provide a visual insight into raw numerical data like lat / long coordinates and data points in a series. I think maps and charts can tell a story too, just like a picture is worth a thousand words, a chart is worth a 1000 data points!

In the past 30 years Vancouver has experienced 4 significant real estate price contractions. 3 of these price contractions are represented in chart form here.

The last contraction was from 1Q 1995 through 3Q 2000 and represented a 13.8% decrease in prices from a high of $418,050 to a low of $360,220.


The previous contraction in 1990 was very short lived at only 3 quarters. This contraction was from 2Q 1990 through 1Q 1991 and represented a 15.3% decrease in prices from $324,710 to $284,750.


The most memorable real estate price contraction in BC history was in 1981. It was memorable because of its magnitude and suddenness. The contraction lasted from 1Q 1981 to 2Q 1985 and it saw nominal benchmark prices decrease 32.3% from $229,730 to $155,560.


Clearly, price contractions can last a long time and represent fantastic opportunities for real estate buyers. We are currently far above the nominal price trendline and one would expect, based on history, that we will see prices fall below the trendline at some point in the future. This will represent a great opportunity for real estate buyers.

The trendline is at roughly $520,000 for the Vancouver CMA detached benchmark and that threshold represents a potential buying point if prices dropped below that mark. Currently prices would need to fall 26.8% for the trendline to be breached. If history is any guide, prices will likely fall below the trendline before the next run up in prices.

Wednesday, August 22, 2007

Fudging - aka - Lying


n. fudge
· A soft rich candy made of sugar, milk, butter, and flavoring.
· Nonsense; humbug.

v. fudged, fudging, fudges
· To fake or falsify: fudge casualty figures.
· To evade (an issue, for example); dodge.
· To act in an indecisive manner: always fudged on the important questions.
· To go beyond the proper limits of something: fudged on the building code requirements.
· To act dishonestly; cheat.


I could tell a story or two about fudge (not the candy) of the mortgage fraud variety of which I have some fairly detailed knowledge. If I did tell some of these stories in their entirety, I am certain I would get into some sort of litigious situation.

In the effort to stay away from lawyers and out of trouble with my employer I will tell you about some scenarios of which I have no personal knowledge, do not involve anyone I know directly and I cannot verify the facts. I can say with certainty that I do not doubt the truthfulness of these scenarios based on my experience. These scenarios come to me from people I know in the financial planning business who do not work for the same institution as me.

As an aside, it is utterly ignorant to suggest that we do not have significant mortgage fraud in Canada, especially in the overpriced markets of the Lower Mainland and Vancouver Island where I may suggest a vast number of approved mortgages are of the ‘fudge’ type.

1) Mortgage Fraud Type 1 – Income Magnification
a. The most blatant form of income magnification strategies that mortgage brokers use is complete fabrication of employment. I have heard of situations in which the applicant tells the mortgage broker – “I work part time as a clerk at a local store and I make $n per month.” The mortgage broker hears – “I own a small company which I work in 6 days a week and collect a salary of $n x 5 per month.” The mortgage is approved under the false pretense of the income being many times larger and more secure than it really is.
b. The more subtle form of income magnification works like this. Mortgage broker is consulting an applicant who does not qualify for the mortgage he wants. Mortgage broker suggests that he install a suite in the home or have foreign home-stay students to increase his qualifying income by $800 per month. The income does not exist and may never exist but the applicant receives the mortgage based on the inflated ‘expected’ income.

2) Mortgage Fraud Type 2 – Disappearing Debts
a. We live in a debt ridden society and consequently many people struggle just to make the minimum payments on their credit cards and lines of credit. People buy trucks, cars, appliances, and home décor on payment plans which all combined can add up to a significant amount of debt with severe restrictions on monthly cash-flow. Mortgage brokers often ignore debts on mortgage applications or move the debts around to make them appear as if they have been paid off so that the mortgage applicant can be approved under the Gross Debt Service Ratios that the lender uses to determine suitability.

3) Mortgage Fraud Type 3 – Anomalous Assets
a. In the heady days of unprecedented real estate appreciation it seems as if an individual can get through life without ever saving a penny in a RRSP account, company savings plan, or just a plain old savings account. After all can’t we all just count on our houses appreciating into infinity providing us with a life of luxury and leisure? Back in the stodgy world of mortgage lending, it still seems as if lenders would like to see that mortgage applicants have assets to prove that they are reputable with a net worth that is more than zero! Mortgage brokers often overestimate what an “asset” is worth, whether it is a vehicle, RRSP account, personal items or an ownership stake in a company to inflate an applicant’s net worth.
b. A variant of the anomalous asset is the Divine Down-Payment or the down-payment that just appeared out of seemingly thin air. This is typically related to parents “helping” their children with a down-payment on a first home.

Monday, August 20, 2007

Hedge-Fund Guy Atones for His Subprime Bond Sins

By Mark Gilbert - Aug. 16 (Bloomberg) --
Dear investor, we'd like to take this opportunity to update you on the recent performance of our hedge fund, Short-Term Capital Mismanagement LLP.

As you know, market selection for the entire fund is guided by a proprietary investing tool we like to call ``a dartboard.'' Once the asset classes are decided, individual security selections are generated by digitizing our unique hexagonal cuboid models.

Unfortunately, it transpires that our hexagonal cuboids are not as unique as we thought. Hundreds of other hedge funds possess identical dice. The technical term for this is a ``crowded trade.'' You may also see it referred to as ``climbing on a bandwagon already headed for the wall.''

As our alpha generation collapses, our beta has turned negative, our delta hedging has gone toxic and, trust me, you do not want to hear about our gamma. We can't even find our epsilons in the dark with both hands.

You will appreciate that accurate pricing is essential for evaluating our investment strategies. This has proven to be extremely challenging in recent days. Previously, we have relied on Bob, the sales guy at Hokey-Cokey Bank. Bob assured us the securities were still worth 100 percent of face value, so everything was cool. Bob sold the collateralized debt obligations to us in the first place, so he knows what he's talking about.

Bob, however, appears to have had a nervous breakdown, judging by the maniacal laughter that greeted our requests for price verification this week. Our efforts to implement an in- house CDO valuation framework, using a technique the ancients knew as ``making things up,'' proved unsatisfactory.

Where's the Bid?

Currently, all of the portfolios we manage are undergoing a rigorous screening known as ``crossing our fingers and praying that we don't have to try and find a bid in the market.'' This is supplemented by a cross-market statistical analysis originally developed by the U.S. military called ``don't ask, don't tell.'' This ``unmarking-to-unmarket'' procedure has been the benchmark for the hedge-fund industry for the past, ooh, 72 hours.

We have, of course, been in touch with the rating companies to update our default-probability scenarios, particularly on the AAA rated investments we own. They recommended a forecasting method using stochastics to regress the drift-to-downgrade timescales for the past 100 years and throw them forward for the next five minutes. The technical term for this is ``induction,'' though those of you of a less quantitative bent may know it as ``guessing.''

AAA or Toast?

We are pleased to report that, contrary to what current market prices might suggest, all of our top-rated securities remain absolutely AAA. Provided, that is, the future performance of the underlying collateral is identical to its history. Otherwise, the rating companies say our investments are likely to be reclassified as ``toast.''

We have also been checking our back-up credit lines with our friends in the investment-banking world. As soon as they return our calls, we'll be able to update you on our emergency liquidity position. We are sure they are fine.

Some of you have written to us asking for your money back, citing clauses in the fund documentation called redemption rights. Frankly, we never expected you to actually read that prospectus, which came prepackaged when we bought the Microsoft Hedge-Fund Guy software. We certainly have no idea what all those long words mean.

We have filed your letters in a special drawer in the filing cabinet marked ``trash'' for now. Do you have any idea how much trouble you all would be in if we actually sold this stuff in the market today? At these crazy prices? Fuhgeddaboudit. You'll thank us later.

Not a Rescue

Speaking of crazy prices, we know you'll be thrilled to learn that we've invited a bunch of our rich pals into the fund to participate in this once-in-a-lifetime opportunity. But this is not a rescue. Do not even think the word rescue. This is an opportunity. Not a rescue. An opportunity.
In fact, we think this is such a fantastic opportunity, we've agreed to forgo our usual management fee, and we'll only take half our usual slice of the profits. Provided there are any profits to slice. You, of course, are absolutely invited to participate in this offer by sending us yet more of your money on exactly the same revised terms as our rich pals.

Finally, a word for all of you who have been kind enough to inquire about my personal financial situation. I am relieved to report that my directors and officers insurance is fully paid up. Furthermore, my Bentley Continental was paid out of the 2 percent fee we levied when you wrote your first check to us, so I will still be able to trundle into the parking lot each morning in an open-necked shirt to ignore your telephone calls and e-mails.

Yours,

Hedge-Fund Guy.

Thursday, August 16, 2007

Name that date - VHB Archive - March 2006

"Even if the demand for houses falls in the outer suburbs, the market will probably never experience a downturn within the city proper. The real estate industry believes it is a captive market. There is virtually no building space left and if the desire to live closer to the city continues , values will keep soaring."

"Speculators are having a field day, with condominium units being a top hunting ground for them."

"It appears that no matter how high prices soar, there will still be buyers."

"We are a hell of a lot more liberal than we used to be" one banker said.

When were these things said? Let's try Oct 5th, 1980 in the Vancouver Province. (link)

Ok, let's try this one:

"While real estate prices have apparently reached a benchmark, there is no decline in house prices - and there won't be according to industry analysts."

"Look, there is a fact of life that people here are going to have to realize. If you want the fruits of living and working in a growing major cosmopolitain city, as everybody obviously does, there is a price to pay for it," an analyst said."Both agreed there is not a hope of prices falling and there is a terrific underlying strength to the market."

"The house prices have reached a temporary peak, simply because of the limitation of the purchasing power ..."

Let's try March 4th, 1981 in the Vancouver Province. (link)

Check the history - prices dropped by around 50% in 1981-82.

Now, we're in 2007 not 1981, so one should be careful in drawing conclusions. But it really is surprising how many of these quotes sound like the kind of things we hear today.

Who took the 'fun' out of fungible?

fungible
"Of or relating to assets that are identical in quality and are interchangeable. Commodities, options, and securities are fungible assets. For example, an investor's shares of Xerox left in custody at a brokerage firm are freely mixed with other customers' Xerox shares. Likewise, stock options are freely interchangeable among investors, and wheat stored in a grain elevator is not specifically identified as to its ownership."


Related stories:
Bank of Canada Provides Liquidity
Banks and Pension Funds Band together to provide liquidity to ABCP market


Notably, the TSX is down over 4.5% so far today in what I would term panic selling at this point in one of the most volatile days that I can remember. From the year's highs in July, the TSX is down approximately 14%. For comparison purposes, the Canadian Value Index is down approximately 11%.


Wednesday, August 15, 2007

NAR Q2 Median Home Prices


The US National Association of Realtors released their 2007 Q2 data on existing home sales and here are some of the highlights of their press release:

"Total state existing-home sales, including single-family and condo, were at a seasonally adjusted annual rate of 5.91 million units in the second quarter, down 10.8 percent from a 6.63 million-unit pace in the second quarter of 2006."

"The national median existing single-family home price was $223,800 in the second quarter, down 1.5 percent from the second quarter of 2006 when the median price was $227,100. The median is a typical market price where half of the homes sold for more and half sold for less, but there has been a downward skew in the national comparison because sales have declined in many high-cost areas and risen in some lower cost markets."

"The median existing single-family home price in the West was $349,400 in the second quarter, down 0.4 percent from a year ago."

I am having trouble with even bothering with the median house price data and determining how useful it is. The median can be moved quite drastically by the sales mix. For example, if a lot of high priced home sell but very few low priced homes sell then the median would obviously be higher. The opposite can also be true.

Ideally, I would prefer a benchmark index like the REBGV or FVREB uses or even better would be a house price index like the Case-Shiller index which uses the repeat sales method for calculating price changes in a real estate market.

Nevertheless, we have this data and it has some use, however limited it may be.

Monday, August 13, 2007

Buy Low, Sell High


Well I am quite refreshed after a week away from the office and the day to day grind. The markets also look quite cleansed after the TSX lost just over 8% of its value since its July high(14,600+ high to Friday's opening of just about 13,300). The S&P 500 also lost over 6% of its value from its July highs.

For the long term investor trying to find some strong companies with depressed stock prices the past week has been a great opportunity and in general it is a good time to have some cash ready to invest in some good deals if they come around. Right now is also a great time to rebalance a portfolio as your asset allocation is likely amiss after the recent volatility.

On the topic of buying low and selling high, my wife and I have sold our home and will be moving. This represents a great move for us personally as we will be moving closer to my work and I will have more time to spend at home. Financially, we will come out smelling like roses with no more mortgage payments and a very large amount of money in the bank from the 'insane' appreciation we have experienced plus a healthy mortgage paydown since we purchased out place 3.5 years ago.

In the effort of being prudent financial managers, we are choosing to not purchase a residence for a time until we find a place that meets our buying criteria.

Mohican's buying criteria:
- 10 minutes or less drive to work
- walking distance to grocery shopping
- monthly mortgage interest + strata + maintenance + property taxes <= equivalent monthly rent
We feel very relieved to be free of our mortgage and the risks that go along with homeownership.

Friday, August 10, 2007

Credit Crunch


By credit crunch I don't mean some new breakfast cereal or chocolate bar, I mean the sudden unwillingness of people to buy junky mortgage debt thus causing a 'liquidity problem.'

It sure looks like I have missed an interesting week in the markets. My vacation will be nice for a couple more days though so I'll provide more next week. Thanks for that interesting post on construction quality M-, very insightful.

Thursday, August 9, 2007

Construction Quality - a 1970's Landmark Building

The following is excerpted from an email I sent to a relative a few months ago when she was searching for a condo in East Van. My "preliminary inspection" was really just a quick walkaround the building to see if it was worth a second look. I figured I'd to my relative a favour and try to save her from her unscrupulous realtor and her lack of basic construction knowledge. I have to apologize for the weak photos-- they were taken on my cell phone. As to my qualifications: I'm a mechanical engineer with experience in mobile equipment and marine construction, and minimal knowledge of residential construction.

Hi A-,

I stopped at #### Wall St quickly to have a look at the building. The condition of the walls raises questions. Two of four walls have been replaced, probably in different years by different contractors. At a quick glance, the building has been painted recently, had a new fence, and looks in good shape, but questions were raised as I walked around the building. Here are my notes:

The North wall looks decent, and looks like the balconies still have the original stucco.

The East wall was replaced with a rainscreened wall at some point, probably within the last 10 years. The rainscreen is evident by the gap at the bottom of the wall, and by the flashings at each floor level. Curiously (I've never seen this before), it looks like the gap at the flashing at each floor level is sealed, which entirely defeats the purpose of a rainscreen-- air is supposed to be able to flow into the wall cavity to dry it out, and water should be able to drain out, but this is only possible for the bottom floor. I would recommend that somebody more experienced than myself look at the construction of this wall.


The South wall looks decent, and looks like the balconies still have the original stucco.


The West wall had the stucco replaced with an Exterior Insulated Face Sealed (EIFS) wall, the same type as the building was built with, and which is generally implicated in leaky-condo problems. This was probably done 5-15 years ago. EIFS wall assemblies have to be tightly sealed, because if water gets in, it can't drain out, and air doesn't pass through the wall quickly enough to dry it out. Since it's impossible to seal rain out completely, water gets in, stays in, and causes rot. This replaced stucco looks to be of a poor quality, as can be seen by the cracks radiating out of a window (which have since been caulked). There's lots of caulking around the door, which implies that the wall has had water problems. Also, where the fence meets the wall, there's a line of old caulking from where the old fence used to sit. From this, I infer that they had water problems with the wall, but were unsure where the water was coming in, or if there were cracks behind the fence, so they caulked the fence to the wall. This is evidence that water problems existed in that wall, even after they replaced it.


Sooo... Two of four original wall assemblies were so poorly built that they had to be replaced. One of the replaced assemblies shows evidence of continued problems. The other assembly was built in an unusual manner, which raises questions. The two original walls, built by the same contruction workers that originally built the two failed walls, have not been addressed. The building may not necessarily be leaking right now, but there's a considerable risk of future problems due to deficiently built original walls and the deficiently-built West wall.

I'll have to retract anything that I may have previously said about Landmark buildings-- I've looked at a couple before, which were decent, but evidently not all their work was done to a high standard.

Regards,
M-

Tuesday, August 7, 2007

The Great Risk Shift

A couple videos for you to chew on while I'm on vacation.

This video wouldn't embed properly.

Thursday, August 2, 2007

July 2007 Fraser Valley Real Estate

Press Release – Sales on the Fraser Valley Real Estate Board's Multiple Listing Service® (MLS®) in July were the second highest on record for that month.

A total of 1,984 sales were processed through the MLS® in July, an increase of 21 per cent compared to 1,635 sales the same month last year, and only a three per cent decrease compared to the strongest July on record, 2,051 sales in 2005.

Jim McCaughan, President of the Fraser Valley Real Estate Board, attributes July's near record sales to a number of factors. "BC's economy continues to hum along, Fraser Valley REALTORS® are receiving a strong influx of new listings and some of our clients are feeling a little uncertainty about where interest rates are going. It all adds up to a desire to invest in real estate now."

The number of active listings in July at 8,376 is 35 per cent higher than July 2006 inventory which sat at 6,200. A total of 3,120 new listings were added to the MLS® in July, compared to 2,657 new listings added in July of last year.

"Average annual price increases remain solid, however we are seeing price increases start to moderate on a month to month basis," says McCaughan. "Demand is strong for townhomes and apartments in Surrey, Langley, Abbotsford and Mission, which is why we continue to see an increase in both the number of sales and prices for those property types."

Townhouses in the Fraser Valley averaged $323,259 in July, a 7.1 per cent increase compared to the average price last year of $301,718. Apartments saw the highest July to July increase at 10.8 per cent with the average price going from $198,882 last year to $220,275 this year.
In July, single family detached homes averaged $519,896, an increase of 6.2 per cent compared to last year's average price of $489,547.


Months of inventory hit 4.4 and will likely rise for the remainder of the year as sales slow and listings increase. Months of inventory has a high correlation to price changes.


Median prices were mixed, as predicted, with detached homes lower, apartments lower, and attached marginally higher. The lower medians indicate that the sales mix is shifting to cheaper accommodation as being the only affordable option for most buyers. Benchmark prices were higher in all categories.

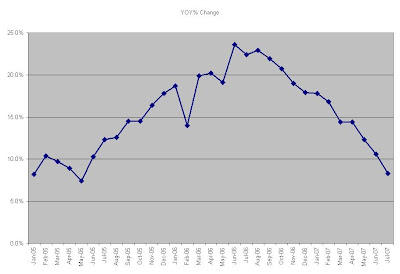
Year over year prices changes peaked in June 2006 at 23.6% YOY and have been declining ever since. My model indicates that the annual price changes should turn negative in the first quarter of 2008 as inventory is likely to keep increasing and sales continue decreasing.