Thursday, June 25, 2009

Greater Vancouver - Inflation Adjusted House Price Index


As promised a few days back, I've put together a chart which shows quarterly Greater Vancouver benchmarked detached House Prices from 1976 to present. I have also added a simple linear trendline to the chart and the year over year change in real prices.

I really think that we have not seen the end of price decreases yet since this would be the smallest correction on record after the biggest boom on record - that would be unusual.

What do you think?

PS - I'm going away for a bit of a break so jesse and other will hold down the fort for the time being. Warm regards.

Wednesday, June 24, 2009

Teranet House Price Index for April 2009

JUNE 2009

Downtrend slower in three cities

Canadian home prices in April were down 6.7% from a year earlier, according to the Teranet-National Bank National Composite House Price Index™. It was the fifth consecutive 12-month decline. April was also the eighth straight month in which the composite index fell from the month before - the longest run of monthly declines since the beginning of index coverage in February 2000. The composite index is now 8.9% below the peak of last August.

Teranet – National Bank National Composite House Price Index™

Contact Us

For general enquiries:

simon.cote@tres.bnc.ca

For licenses covering all index-linked products, please contact:

Simon Côté
simon.cote@tres.bnc.ca
514 879-5379

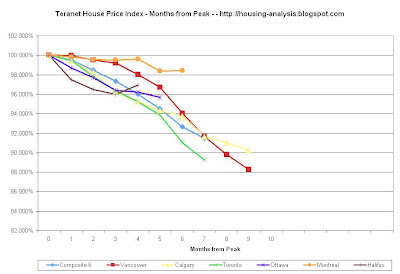
Of the six constituent city indices, three were down from a year earlier: Vancouver (−10.9%), Calgary (−9.8%) and Toronto (−7.6%). Three cities held out against 12-month deflation, though with marked deceleration of their 12-month rises: Montreal (2.4%), Ottawa (0.6%) and Halifax (0.2%). The 12-month price increase in Halifax was the first since January. Calgary prices have been correcting for well over a year now, since August 2007, and are now down 13.3% from the peak of that month. Calgary has shown monthly declines in 17 of the 20 months posted since then, including the 10 consecutive months from last July through April.

Vancouver prices have also shown 10 straight monthly declines and are down 11.9% from peak. Toronto prices have declined eight months in a row and are 11.3% below peak. In Ottawa the downtrend is less pronounced: prices have declined in each of the six months since the October peak and are now down a cumulative 4.8%. Halifax and Montreal prices were up from the previous month in both March and April and are now only 1.7% and 1.4% below their respective peaks.

Teranet – National Bank House Price Index™

The historical data of the Teranet – National Bank House Price Index™ is available at www.housepriceindex.ca.

Metropolitan areaIndex level
April 2009
% change m/m% change y/yFrom peakPeak Date
Calgary152.01-0.6 %-9.8 %-13.3%August 2007
Halifax119.811.4 %0.2 %-1.7%November 2008
Montreal120.790.2 %2.4 %-1.4%September 2008
Ottawa112.53-0.5 %0.6 %-4.8%October 2008
Toronto104.01-0.6 %-7.6 %-11.3%August 2008
Vancouver132.67-0.3 %-10.9 %-11.9%June 2008
National Composite119.19-0.4 %-6.7 %-8.9%August 2008

The Teranet–National Bank House Price Index™ is estimated by tracking observed or registered home prices over time using data collected from public land registries. All dwellings that have been sold at least twice are considered in the calculation of the index. This is known as the repeat sales method; a complete description of the method is given at www.housepriceindex.ca

The Teranet–National Bank House Price Index™ is an independently developed representation of average home price changes in six metropolitan areas: Ottawa, Toronto, Calgary, Vancouver, Montreal and Halifax. The national composite index is the weighted average of the six metropolitan areas. The weights are based on aggregate value of dwellings as retrieved from the 2006 Statistics Canada Census. According to that census1, the aggregate value of occupied dwellings in the metropolitan areas covered by the indices was $1.168 trillion, or 53% of the Canadian aggregate value of $2.207 trillion.

All indices have a base value of 100 in June 2005. For example, an index value of 130 means that home prices have increased 30% since June 2005.

By:

Marc Pinsonneault
Senior Economist
Economy & Strategy Team
National Bank Financial Group

Teranet - National Bank House Price Index™ thanks the author for their special collaboration on this report.

1 Value of Dwelling for the Owner-occupied Non-farm, Non-reserve Private Dwellings of Canada.

Friday, June 19, 2009

Inflation and House Prices

Following up on a conversation in the previous post, I thought it would be interesting to look at the correlation between consumer price inflation and house prices. This chart shows YOY BC CPI and the YOY change in Nominal Benchmarked house prices for Greater Vancouver. Click on the chart to make it bigger.


The correlation between the two series is 0.18 - not strong, but positive. I think we need more data than 15 years to prove conclusively that there is a link between inflation and house prices. The fact of the matter is that inflation has been relatively low for a very long period of time and interest rates have fallen dramatically during this low inflation period. We don't really know what much higher inflation will do to real estate values of the short / medium term but we do know that real estate is a very interest rate sensitive asset since most people use borrowed money to buy real estate. If I look back at high inflation periods in the past (the 70s), house prices were a much smaller multiple of personal incomes than they are today and rates were also much higher than they are today which would indicate that affordability is a combination of the interest rate and the price - duh!

If we expect inflation then we should also expect much higher interest rates eventually to bring the inflation down and this would deflate house prices as current house prices with a 10% or 15% mortgage rate would be out of reach for all but the super rich. As we know, the housing market is fundamentally a supply / demand based market and if there is no demand at a given price the price will fall until the price meets someone's ability to pay.

Wednesday, June 17, 2009

500 Posts and Housing Market Indicators

Well this represents the 500th post on this blog. This blog was started out of a personal and occupational interest in finance and real estate. I was concerned with the price of real estate and the detrimental effects that unsustainably high house prices would have on the economy, personal finances, and my own personal life. This blog has been meeting my needs for an analytical outlet and a research topic area that is not well understood by many people in the finance profession. I hope you all find it interesting, I know that I do. I recently have especially appreciated collaborating with others on many posts and topics.

In the vein of thinking about the direction of the housing market, I stumbled across some data that I've had sitting on my computer for some time that I found quite interesting but have never posted for some reason. The data comes from http://www.macromarkets.com/ - who started and continue to operate the housing market futures trading on the CME.


So, let's talk about what these indicators mean to us in Vancouver. If we start with the premise that there should be no significant differences between the correlations in US markets and Vancouver, we can use the correlation data above to make some informed observations about the local market and perhaps on the future direction of the market. I think this is a fair assumption given that it makes reasonable sense to see correlations between housing starts, construction spending, unemployment and house prices.

For the record:
  • Construction spending is way down in Vancouver at the moment.
  • Housing supply is elevated but much lower than last year.
  • Mortgage applications are not tracked officially on a local level but anecdotally they are up from last year.
  • Housing starts are way down from last year.
  • Building permits are also way down.
  • New home sales are low but higher than last year.
  • Median rent is high in Vancouver compared to other Canadian cities.
  • Personal income is falling right now.
  • The unemployment rate is rising.

Now what do you think?

Wednesday, June 10, 2009

Ask Dr. Housing Analysis

With mortgage rates very low these days -- I'm hearing people pulling 3.5% on a 5-year closed -- the buy-vs-rent bugbear rears its ugly head once again but now, on the face of it, ownership costs have dropped significantly from last year through a combination of price drops and interest rate cuts.

I keep hearing comments on blogs and amongst friends and family about how the buy-vs-rent equation has decidedly shifted to the buy side, given one's propensity to own instead of rent, so if the math works why not buy now? In some jurisdictions the tax laws favour owning biasing the calculation further, from a buyer's point of view.

So instead of lecturing on my views, I thought I'd present a real-life case from someone I know, inspired by Fish10 and, for wily veterans of the Vancouver housing blog scene, the old "Ask VHB" posts of yore.

For a change this person is not in the Vancouver area. Please feel free to analyse the situation in the comments. I'll post the "correct" answer in a few days. You will be marked on your analytical ability; this is, after all an "analysis" blog so don't suck.
Yo,

Right. There is a tax scheme in Holland such that it is actually cheaper to buy a house on an interest-only scheme than to pay rent. Long story short:

I’ve got the 30% tax relief, so the first 30% of my salary is non-taxable (a benefit for being an expat.) Mortgage interest payments are deductible in full – so would save big time on that if I were paying interest only.

All in all it makes sense IFF [if and only if] the value of the house rises by more than 10% by the time I sell it (because in the purchase fee is approx 10% fees, all borne by the buyer). So I’ve been looking into prices and here in Holland they’ve just started to drop – last month prices dropped across the board.

Here’s the official government statistics site (in English!) with some fun stats.

By looking at this, to me it seems like it might be a good time to start looking, but would appreciate your nerdly view on things too!

Nerdlings, what say you...?

Monday, June 8, 2009

Teranet Data in Graphs

I know Jesse will probably post a more comprehensive set of charts regarding the Teranet House Price Index but I thought I would throw these two charts up for discussion. As you may know, Teranet uses the 'sales pair' methodology to track price changes and it has proven to be the most accurate way of determining price changes for real estate.


CMHC Housing Starts for Greater Vancouver

The CMHC released preliminary housing start data for areas across Canada today and here is the picture for Greater Vancouver.

There were only 469 housing starts in May 2009 contrasting with 1757 in May 2008. Ouch.
Starts are on a steep downward slope right now and 2009 is shaping up to be the worst year in recent memory for new development. Construction jobs are being shed at a record rate right now as projects complete and less new projects fill in the pipeline behind them.

Saturday, June 6, 2009

Vancouver Benchmark versus Case Shiller Update

A quick update on GV benchmark compared to various US markets as tracked by the Case-Shiller HPI. I will show two graphs. One is the raw benchmark value the other is a 3 month moving average. The 3 month moving average (trailing -- this is not quite correct and I should be using balanced average as Thompson on RET pointed out but hey it is what it is) is probably a better comparison to Case-Shiller. But still, one can see the "spring bounce" is here. If you're buying on technicals, hey, throw in some moving averages to this graph and justify buying at today's values. Good luck with that. We'll have speaks in 2012.


Update

I have run the numbers comparing the Teranet HPI to the benchmark. In the short run, the Vancouver benchmark tracks Miami very well on the above graph, but even more surprising is that Toronto's HPI is falling faster than Vancouver's from peak, though Vancouver has fallen more in % terms. I will post the graphs in a subsequent post. We should not be surprised that the benchmark deviates from the HPI, though from what I have seen in the long run the two will eventually track each other reasonably well. It looks as if the benchmark has "overestimated" price drops but may now be "underestimating" them.

Wednesday, June 3, 2009

Greater Vancouver Real Estate - May 2009

Stats package from the Real Estate Board of Greater Vancouver is out. Check it out here.

Sales are pretty hot in the Greater Vancouver area. Interest rates have come down enough that it has reduced the prospective monthly payment of a homebuyer by 30%. Combine that improvement in affordability with the price correction witnessed over the past 12 months and I can certainly understand why sales have been brisk.


Active listings have not moved up as much as last year. Sales have taken some inventory out of the market but that doesn't explain the big difference between this year and last year. I suspect that many potential homesellers are waiting until after the 2010 winter olympics with the hope that the games will goose the market upward.


With higher sales and lower listings, months of inventory has fallen dramatically.

House prices have moved up handily in the past three months as buyer competition has been the norm with a low MOI.

The correlation between MOI and price changes is very high and as expected, last month was no exception with a low MOI relating to an increase in prices.
It should be very interesting to see how the rest of the year plays out. With a continued low MOI, I expect prices to inch upwards. If mortgage rates continue to inch upwards from the recent lows, it will probably take a lot of the sales out of the market and push listings upward. The past 12 months have witnessed a massive 40% improvement in home purchasing affordability but prices are still incredibly out of line with local rents and incomes and I fully expect that over the next 2-3 years we will see further price erosion.

Fraser Valley Real Estate - May 2009

Charts to come later.  Here is the press release from the FVREB:

(Surrey, BC) – The Fraser Valley real estate market continued to show signs of rebalancing in April with the number of sales increasing for the third month in a row while the volume of available properties stayed constant. Benchmark prices for detached homes and condominiums also showed increases over the last three months.

There were 1,293 sales processed on the Fraser Valley Real Estate Board’s Multiple Listing Service® (MLS®) in April, refl ecting a 28 per cent decrease compared to the 1,787 sales in April of last year, however, a 29 per cent increase over March sales. At the same time, the Board received 44 per cent fewer new listings compared to one year ago, 2,477 in contrast to 4,458 in April 2008, helping to stabilize the number of active listings in the Fraser Valley at 9,855.

Paul Penner, President of the Board, says current conditions have created one of the best buying opportunities in years. “REALTORS ® have successfully communicated to their sellers to be more realistic with their prices, which is why we’ve seen a 29 per cent increase in sales from March to April.”

Penner also attributes the increase to all-time historically low interest rates and still relatively high inventory for Fraser Valley, although it is dropping rapidly.

“In April, REALTORS® received 44 per cent fewer new listings compared to a year ago and 18 per cent less than we received in March. When supply and demand start to balance out, the effect is that prices begin to fi rm up and that’s exactly what we’re seeing.”

Residential benchmark prices, the value of a ‘typical’ Fraser Valley detached home as determined by the MLSLink® Housing Price Index (HPI), decreased 10.4 per cent compared to April 2008. However, it has increased by 1.8 percent over the last three months. The
benchmark price was $460,229 in April 2009 compared to $513,403 last year.

The HPI benchmark price of Fraser Valley townhouses decreased 11.6 per cent from $333,982 in April 2008 to $295,078 in April 2009. That decrease, however, slowed to 0.1 per cent during the last three months. The benchmark price of apartments also decreased year-over-year by 11.4 per cent going from $260,037 in April of last year to $230,337 in April 2009. Similar to detached homes, the benchmark price for apartments has increased by 4.4 per cent over the last three months.