Friday, January 9, 2009

Vancouver Housing Starts - December 2008

The Canada Mortgage and Housing Corporation released December 2008 housing starts data for the Vancouver Census Metro Area this morning and here is the data. Starts are continuing to moderate although developers started construction on 1108 housing units during the month which is still a very brisk level of activity.

I am looking for starts to moderate quite a bit more during 2009 with several months having less than 1000 units started. This will be a far cry from the past few years level of activity.

Thursday, January 8, 2009

Calgary Real Estate Market Under Pressure in 2008

The Calgary real estate market transitioned very quickly from hot to not hot in 2007. It came under increased negative price pressure during 2008 as there were many more home sellers than buyers. In 2008 we witnessed the median home price in Calgary start the year at $368,500, peak at $386,000 and finish the year at $340,000 for a sizeable annual decline of $28,500 or 7.7%. The Calgary real estate market peaked in July 2007 at a median price of $392,000 so we have now witnessed a drop of $52,000 or 13.3% over a 18 month period.

The Teranet - National Bank House Price Index data also bears these price decline numbers out.


Inventory is at elevated levels still and sales are quite low which gives the Calgary market little hope for any price appreciation during 2009. With over 10 months of inventory at the end of 2008, there may be a bright month or two but look for continued declines this year.
See the data for yourself here.

Tuesday, January 6, 2009

Greater Vancouver Prices Decline Dramatically for 7 Months in a Row

Data from REBGV Press Release.

2008 certainly was an interesting year for real estate market observers in Vancouver. For nearly 2 years the local market bucked the declining price trends seen in the US and elsewhere. Pundits had proclaimed that the local market was immune or insulated from the turmoil elsewhere. Oh how wrong they were. Benchmark detached home prices in the Greater Vancouver area are now at the same level as they were in June 2006.

This story is really all about supply and demand. There is lots of supply with even more coming and very little demand. Active listings are significantly above previous year's levels so the supply side is not helping those who want higher prices.


One may look to the demand side of the equation for some hope for some price appreciation but monthly sales are at half the level they were during the boom years with no quick fixes in sight.
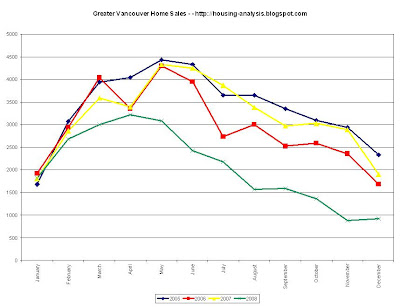
Consequently, it would take a very long time, 16.4 months to be exact, for the current level of inventory to be sold off at the current rate of sales. This essentially means that the market is completely saturated with product and the only sales to be seen are the deep discounts.


The correlation between months of inventory and price changes is extremely tight with any MOI level above 7 MOI indicating further price declines. At the current level of more than double that, I do not expect rising prices anytime soon.

As mentioned previously, prices are now back at mid-2006 levels and the retreat has only begun. I fully expect inventory to swell in the new year and sales to continue at a lacklustre pace which will put continued and significant negative price pressure on sellers for the next while.


Good luck to everyone.

Fraser Valley Real Estate Now at 7 Months of Price Declines

Active Listings in the Fraser Valley real estate market fell by a normal seasonal amount from November to December as many hopeful real estate sellers pull their homes off the market during the dreary winter months hoping for better luck in the spring. Good luck with that. Active listings are at the highest year end level for which I have records which does not bode well for those trying to get top dollar for their listed properties in 2009. Click on a chart to enlarge it for a better view.


Sales were extremely low at well under half the monthly volume of the heyday years of not so long ago. 508 sales is very little. It amuses me how the Real Estate Board highlighted the fact that December sales were higher than November sales. Yes, I can do math too Kelvin - - 508 is bigger than 507. How this is relevant I do not know.

Months of inventory remains highly elevated and is an important indicator of a distressed real estate market at these levels. Look for further price declines throughout 2009.


The sell list ratio is extremely low which indicates that very few real estate wanna-be-sellers are turning into real estate sellers. Consequently, price pressure is highly negative as those who must sell are forced to lower prices to draw in potential buyers.

Median Prices are continuing to retreat.

The correlation of the supply/demand metric and price changes is continuing to be remarkably resilient as we have moved to the other end of the see saw. It is as if somebody flipped a switch in May 2008 and buyers stopped showing up.

Benchmark home prices, which are the best indicator of the actual change in property values have declined nearly 10% now and values are at the September 2006 level.


The story for 2009 will be more of the same. Bargain hunters will likely start seeing more and more value as desperate sellers try to move their properties. I fully expect that 2009 will be a flipper bloodbath as many of these wanna-be real estate moguls get smacked with month after month of carrying costs and are forced into the new reality of declining real estate values. If you need to sell a home in 2009 make sure you price it lower than everybody else unless you want to chase the market down.

Monday, January 5, 2009

Fraser Valley Real Estate Prices Continue Falling

From the Fraser Valley Real Estate Board. More analysis to come later.

2008 YEAR OF CHANGE AND OPPORTUNITY FOR FRASER VALLEY REAL ESTATE MARKET

(Surrey, BC) – December’s sales statistics from the Fraser Valley Real Estate Board’s Multiple Listing Service (MLS®) reflect thereal estate story of 2008: change. Sales of all property types for the year declined 30 per cent in the Fraser Valley; however, sales for the month were down almost 50 per cent compared to December 2007 – punctuating how the move to a buyers’ real estate market, similar to changes overall in the economy, took place in the second half of 2008.

Residential benchmark prices, the value of a ‘typical’ Fraser Valley detached home as determined by the MLSLink® Housing Price Index (HPI)*, decreased 6.5 per cent this year, with December showing the seventh consecutive monthly decline. The benchmark price was $496,391 in December 2007 compared to $464,189 last month. That price has decreased 9.7 per cent since May 2008 when it was $513,798.

The HPI benchmark price of Fraser Valley townhouses decreased by 8 per cent in one year, going from $322,295 in December 2007 to $296,296 in December 2008, while the benchmark price of apartments decreased from $247,822 to $237,786, a - 4 per cent change in one year.
“Prices could not have continued to increase at the pace they were over the past six years,” says Kelvin Neufeld, President of the Fraser Valley Real Estate Board. “The change in the real estate cycle has created tremendous opportunities for consumers right now and they’re starting to recognize that fact.


“Fraser Valley REALTORS® were already seeing home sales in early December surpass those of November, signaling that buyers recognize the current advantages of price reductions combined with historically low interest rates and inventory at record levels.” Fraser Valley’s total sales volume in 2008 was 13,194 compared to 18,862 in 2007. Over the course of the year, Fraser Valley REALTORS ® listed 35,651 properties, an 8 per cent increase compared to 2007’s 32,953 listings. The number of active listings at year’s end finished at 9,960, 50 per cent higher compared to 6,646 active listings in December 2007.

Year-to-date average prices of single-family detached homes in the Fraser Valley increased 3.4 per cent going from $520,317 in December 2007 to $537,960 in December 2008. In one year, the average price of a townhouse increased 3.6 per cent going from $322,578 in 2007 to $334,259 in 2008. The average apartment price increased 5.8 per cent, reaching $229,488 in 2008 compared to $216,990 in 2007.

Real Estate Prices fall again in December 2008

Here is the press release from the Real Estate Board of Greater Vancouver. More analysis to come later.

2008 brought improved housing affordability to Greater Vancouver

VANCOUVER, B.C. – January 5, 2009 – The record-breaking real estate market cycle in Greater Vancouver, longer than normal at seven consecutive years, ended in 2008 amidst global economic challenges. The change brought relief from rising prices that saw benchmark prices escalate from $357,770 for a single family detached home in December 2001 to $648,421 by December 2008.

The Real Estate Board of Greater Vancouver (REBGV) reports that sales of detached, attached and apartment properties decreased 35.3 per cent in 2008 to 24,626 sales compared to 38,050 sales in 2007. Property listings for the year increased 13.9 per cent to 62,561 compared to 2007 when 54,945 new properties were listed. “Trends in the latter half of 2008 showed a consistent month-over-month decrease in residential housing prices, a departure from the rising home prices and record-breaking sales that were experienced in Greater Vancouver for much of this decade,” said REBGV president, Dave Watt.

“It’s also important to note that our December statistics show a third consecutive month of a decrease in active property listings in Greater Vancouver. That means supply is coming down,” Watt said. “Last month was also the first time in 27 years that Greater Vancouver homes sales for December were higher than November.”

Residential benchmark prices, as calculated by the MLSLink Housing Price Index®, declined 10.9 per cent between Decembers 2007 and 2008. Since May 2008, the overall residential benchmark price has declined 14.8 per cent in Greater Vancouver to $484,211 from $568,411.
“For buyers, lower prices haven’t been a concern as much as the perception that prices are falling. It’s difficult to identify the ‘bottom’ of the market. The reality is that people tend to buy when prices are going up, not when they’re going down,” Watt said.


In December 2008, sales of detached, attached and apartment properties totalled 924, a decrease of 51.3 per cent compared to the 1,897 sales in December 2007. New listings for detached, attached and apartment properties declined 8.6 per cent to 1,550 in December 2008
compared to December 2007 when 1,695 new units were listed. Total listings in December declined 17.2 per cent to 15,193 from the 18,348 total active listings in Greater Vancouver in November 2008.


Sales of detached properties in December 2008 declined 48.7 per cent to 348 from the 679 units sold during the same period in 2007. The benchmark price for detached properties declined 11.2 per cent from $730,399 in December 2007 to $648,421 in December 2008. Since May 2008, the benchmark price for a detached property in Greater Vancouver has declined 15.9 per cent.
Sales of apartment properties declined 53.7 per cent last month to 417 compared to 901 sales in December 2007.


The benchmark price of an apartment property declined 11.7 per cent from $377,579 in December 2007 to $333,275 in December 2008. Since May 2008, the benchmark price for an apartment property in Greater Vancouver has declined 14.5 per cent. Attached property sales in December 2008 decreased 49.8 per cent to 159, compared with the 317 sales in December 2007.

The benchmark price of an attached unit declined 7.4 per cent from $456,941 in December 2007 to $423,338 in December 2008. Since May 2008, the benchmark price for an attached property in Greater Vancouver has declined 11.6 per cent.

Friday, January 2, 2009

Case Shiller House Price Index - October 2008 Data


The inspiration for the chart above (click to enlarge) comes from the Seattle Bubble Blog.. The chart shows the total decline in value from peak pricing in all of the 20 Case Shiller markets plus I've added Vancouver using the REBGV Benchmark House Price Index. I have started all the markets at 100 at their peak month so all the markets start out at the same spot.

Vancouver's real estate prices are falling faster than any US market 7 months into our correction and it sure seems like that won't be changing anytime soon with nearly 20 months of inventoryin the REBGV area as of December 31st, 2008.

Miami, Phoenix, Los Angeles, San Diego, San Francisco, Detroit and Las Vegas are the biggest decliners to date with total declines in the range of 35 - 40% off peak pricing 2 years into the correction. I am optimistic that we may see a bottom forming in some markets late in 2009 but more likely early 2010 in the US. Affordability has been restored in many places so it is realistic to suggest that we could see some stabalization.