From the Financial Post:
OTTAWA - The selling price of new homes in Canada went down by 0.1% between November and December, the third consecutive monthly decrease, Statistics Canada said Wednesday.
Builders in Saskatoon cited reduced labour costs as new housing prices fell by 0.7% in that city, while prices went down by 1.3% in Calgary and 0.3% in Edmonton, the federal agency said. Monthly prices increased slightly by 0.2% in Ottawa–Gatineau in December, but remained unchanged in Toronto and Oshawa, Quebec, Montreal and Vancouver.
On a year-over-year basis, the new housing price index increased by 0.4% in December, a slower pace than the 0.7%t increase recorded in November.
The largest year-over-year increase in new housing prices was registered in St. John's at just over 24%, followed by Regina at 21.7%.
Compared with December 2007, Statistics Canada says contractors' selling prices were 4.5% higher in Ottawa–Gatineau and nearly 2% higher in Toronto and Oshawa.
New housing prices in Saskatoon rose by 0.9% year-over-year, confirming a continuing trend of deceleration in this city.
Vancouver and Victoria also posted year-over-year declines in new housing prices for the third consecutive month.
Canwest News Service
Wednesday, February 11, 2009

Monday, February 9, 2009
Relationship between Months of Inventory and Price Changes in GVREB
Here is an update on the refined half-over-half price changes to months of inventory (3 month moving average) relationship mohican and I optimised last year.
{
Nerd_verbosity++;
First the residual plots.

And the 95% CI fitted line.

We can see even with the deviation of last month we have high degree of confidence. It is easy to show a frequency component of seasonality so a high correlation is somewhat expected. Still, there ain't no purdy red dots on the bottom left and top right of the graph so it tells me a storm's a-brewin'.
And for completeness, the time plot.
{
Nerd_verbosity++;
First the residual plots.

And the 95% CI fitted line.

We can see even with the deviation of last month we have high degree of confidence. It is easy to show a frequency component of seasonality so a high correlation is somewhat expected. Still, there ain't no purdy red dots on the bottom left and top right of the graph so it tells me a storm's a-brewin'.
And for completeness, the time plot.


CMHC Housing Starts for January 2009
I'm busy - charts to come later. From here.
VANCOUVER, February 9, 2009 – According to Canada Mortgage and Housing Corporation (CMHC), construction started on about half as many homes this January compared to the same month last year. Builders broke ground on fewer single detached homes and multiple unit projects.
“The January numbers are an indication of things to come” said Robyn Adamache, senior market analyst, CMHC. “The slowing trend that began in the last part of 2008 will continue, with fewer housing starts forecast for the year ahead. A well-supplied resale market and a growing stock of unsold new homes on the market, mean that developers are holding off on new projects until more of the existing inventories are absorbed.”
Moving east to Abbotsford, just 13 new homes were started in January, down from 101 units a year earlier. Home starts in Abbotsford are also expected to moderate from last year’s high levels in 2009.
Provincial home starts declined to 14,100 units, seasonally adjusted at annual rates (SAAR) from 19,900 units in December 2008. At the national level, housing starts moved lower in January to 153,500 units (SAAR) from 172,200 units (SAAR) in December.
As Canada’s national housing agency, CMHC draws on more than 60 years of experience to help Canadians access a variety of quality, environmentally sustainable, and affordable homes — homes that will continue to create vibrant and healthy communities and cities across the country.
I'm still a little confused about that last paragraph.
VANCOUVER, February 9, 2009 – According to Canada Mortgage and Housing Corporation (CMHC), construction started on about half as many homes this January compared to the same month last year. Builders broke ground on fewer single detached homes and multiple unit projects.
“The January numbers are an indication of things to come” said Robyn Adamache, senior market analyst, CMHC. “The slowing trend that began in the last part of 2008 will continue, with fewer housing starts forecast for the year ahead. A well-supplied resale market and a growing stock of unsold new homes on the market, mean that developers are holding off on new projects until more of the existing inventories are absorbed.”
Moving east to Abbotsford, just 13 new homes were started in January, down from 101 units a year earlier. Home starts in Abbotsford are also expected to moderate from last year’s high levels in 2009.
Provincial home starts declined to 14,100 units, seasonally adjusted at annual rates (SAAR) from 19,900 units in December 2008. At the national level, housing starts moved lower in January to 153,500 units (SAAR) from 172,200 units (SAAR) in December.
As Canada’s national housing agency, CMHC draws on more than 60 years of experience to help Canadians access a variety of quality, environmentally sustainable, and affordable homes — homes that will continue to create vibrant and healthy communities and cities across the country.
I'm still a little confused about that last paragraph.
Friday, February 6, 2009
Labour Market Problems in BC
Just a few weeks ago, Helmut Pastrick told us:
Maybe I shouldn't pick on him too much. He's not alone in being rosy with the forecast. Then again, some people did mention a long time ago that our labour market boom was based on construction, and that this was not likely to be sustainable once the construction boom stopped.
I'm sure that the newspapers will tell us that such a change in employment came out of left field; 'no one' predicted it. Hoocoodanode?
Anyway.
The labour market in BC took a very sharp worse turn in January. Here are the pictures.

The unemployment rate shot up to 6.1%. The proportion of people with jobs fell under 62%.
This can be seen in clearer context by looking at this long run picture:
 You might notice that the other times we've seen such sharp movements have been in deep recessions. One might therefore predict that we are starting a serious recession here. But time will tell for sure.
What I do know is this. If the labour market continues to spiral in this direction, the housing market is seriously toast.
When the bubble started to burst in Spring 2008 in the midst of a strong economy, it burst mostly because there was a psychological change--people stopped wanting to pay the inflated prices because they didn't have confidence that they could find a greater fool to whom to unload their property in the future. We've seen 15% or so come off prices, but the main effect really has been that properties have just sat around not getting sold. Aside from a few flips gone bad, there hasn't been a lot of urgency on the sell side. So it didn't sell in 2008--just rent it or try again in 2009.
What will be different going forward is this. As unemployment approaches double digits in BC (we'll get there shortly after the Olympics--if not earlier), there will be thousands of people who cannot make their mortgage payments on their primary residence--not to mention their inability to feed the monthly bleed from their condo 'investments.' These properties will be thrown back on the market first by themselves, and later by banks as foreclosures.
When will this happen? When people lose their job, it takes some time before they get irreversibly behind on their bills. It then takes some time for the bank to foreclose and get the thing on the market. So, the 'have to sells' are not going to seriously start hitting the market until late 2009. But in 2010, this will be a dominant part of the housing picture.
So, let's add this up. We have record new housing inventory on the way. We will have a cascade of 'have to sell' people driven by job losses. On the demand side, speculators are out of the market. As well, home ownership rates are at record level, which means we have borrowed a large part of demand from the future--how many 22 year olds were buying condos pre-boom? How many rushed to 'get in' before they were 'priced out'? And that's just the local stuff--not to mention the impact of a worldwide (including Asia) economic meltdown. This sums to one thing: 2009-10 are going to provide a tremendous amount of pain for those who are overexposed to Vancouver real estate.
British Columbia's economy will lose 42,500 jobs this year and another 6,500 in 2010, Central 1 Credit Union chief economist Helmut Pastrick forecasted this week. If his dire prediction comes true, it will be the first time the province will have seen successive years of declining employment in more than a quarter century. But keep in mind that those are reductions of just under two per cent and 0.3 per cent respectively, hardly the wholesale losses of about five per cent B.C. saw during the recession of '82, and Pastrick expects employment to recover to 2008 levels by 2011. In the meantime, however, Central 1 expects B.C.'s unemployment rate to rise from 4.5 per cent last year to 6.7 per cent in 2009, and climb even further to 7.5 per cent next year.Well, we now have the January numbers and we're already down 35,000 jobs. Only 7,500 more to go to reach Helmut's 2009 prediction. Or, more likely, Mr. Pastrick will have to revise his prediction.
Maybe I shouldn't pick on him too much. He's not alone in being rosy with the forecast. Then again, some people did mention a long time ago that our labour market boom was based on construction, and that this was not likely to be sustainable once the construction boom stopped.
I'm sure that the newspapers will tell us that such a change in employment came out of left field; 'no one' predicted it. Hoocoodanode?
Anyway.
The labour market in BC took a very sharp worse turn in January. Here are the pictures.

The unemployment rate shot up to 6.1%. The proportion of people with jobs fell under 62%.
This can be seen in clearer context by looking at this long run picture:
 You might notice that the other times we've seen such sharp movements have been in deep recessions. One might therefore predict that we are starting a serious recession here. But time will tell for sure.
What I do know is this. If the labour market continues to spiral in this direction, the housing market is seriously toast.
When the bubble started to burst in Spring 2008 in the midst of a strong economy, it burst mostly because there was a psychological change--people stopped wanting to pay the inflated prices because they didn't have confidence that they could find a greater fool to whom to unload their property in the future. We've seen 15% or so come off prices, but the main effect really has been that properties have just sat around not getting sold. Aside from a few flips gone bad, there hasn't been a lot of urgency on the sell side. So it didn't sell in 2008--just rent it or try again in 2009.
What will be different going forward is this. As unemployment approaches double digits in BC (we'll get there shortly after the Olympics--if not earlier), there will be thousands of people who cannot make their mortgage payments on their primary residence--not to mention their inability to feed the monthly bleed from their condo 'investments.' These properties will be thrown back on the market first by themselves, and later by banks as foreclosures.
When will this happen? When people lose their job, it takes some time before they get irreversibly behind on their bills. It then takes some time for the bank to foreclose and get the thing on the market. So, the 'have to sells' are not going to seriously start hitting the market until late 2009. But in 2010, this will be a dominant part of the housing picture.
So, let's add this up. We have record new housing inventory on the way. We will have a cascade of 'have to sell' people driven by job losses. On the demand side, speculators are out of the market. As well, home ownership rates are at record level, which means we have borrowed a large part of demand from the future--how many 22 year olds were buying condos pre-boom? How many rushed to 'get in' before they were 'priced out'? And that's just the local stuff--not to mention the impact of a worldwide (including Asia) economic meltdown. This sums to one thing: 2009-10 are going to provide a tremendous amount of pain for those who are overexposed to Vancouver real estate.
Thursday, February 5, 2009
The Argument Against Value Analysis in Vancouver
Much has been made by me and other long-time commenters on this blog about what housing prices would be in the absence of a bubble, the market's so-called fundamental value. Yet Vancouver's housing market has rarely (not never) been at a "fundamental" valuation in the past generation. Does value investing have a place in Vancouver real estate if prices rarely agree with the theory? I will outline the case for why not and offer some commentary.
Here I have attempted to paraphrase many of this blog's comments into this post. The information is not new, only presented. I do hope that readers, if they have time, read some of the comments here and in the archives for more insights into the fascinating subject of real estate in Vancouver, the "most bubbly city in the world".
The simple way of determining fundamental value is to look at an asset's current and expected future cash flows, discount them at your cost of capital, and sum them up. mohican uses a simple formula that I crudely derived here. There are other simpler and more complex methods of course and there is always disagreement over assumptions. With Vancouver specifically the last time properties were valued at what I consider to be fundamental valuation was around 2000 and before that in the mid '80s. Others will say 2000 was never at fundamental valuation, a local minimum that never quite reached the trigger point for them to consider it a good value investment.
The question is, if fundamental valuations have not been present since, say, the mid '80s, do they still have merit? The argument for why fundamental analysis is flawed for Vancouver real estate goes as follows. Real estate consists of cash flows from rents and capital appreciation. The Vancouver market has had many boom-bust cycles in its past. Even if an investor buys when prices are above fundamental value (not necessarily at the peak, mind), a subsequent boom cycle will allow the investor to exit with a decent overall return. Booms and busts are inherent to Vancouver's psyche. Given enough time, typically 7-10 years, you will always be able to cash out positive, the caveat being of course you avoid buying near or at the peak. Fundamental valuation is therefore rarely, if ever, achieved because investors anticipate future bubbles to compensate for poor rental yields.
In a nutshell, that is the argument. And before commenters rip it apart I will say that many people over the past generation have made decent real (or paper…) returns in this fashion. Most I have had discussions with do not engage in "pure" speculation (i.e. flipping) but actually rely mostly on rents for their return; "mostly" because for the return to really make sense they require some form of capital appreciation above inflation. The speculative component (i.e. prices above fundamentals) is apparently omnipresent within a typical investor's time frame.
The Vancouver price graph is indeed "biased" above fundamental value. So the argument goes, as I can make it out, you may have to wait a long long time for true fundamental valuations to return. If this is true, that Vancouver has a propensity for speculation, prices may never retreat to fundamentals in one's lifetime. In fact this is effectively the argument I hear on local blogs and amongst my acquaintances and family. Really they are saying that Vancouver is full of greater fools who will inevitably compensate us for poor cash flows or that their still fruitless but eternal hope of real income growth will manifest itself. And maybe they are right.
Of course speculation is a zero sum game and many we know have done well in the past generation in their real estate investments, "others" not so much. Here though I lob a few words of caution into the hubris.
First the assumption that Vancouver will experience another boom-bust cycle in most investors' time horizons is just that -- an assumption. There are precedents in other cities, most notably Tokyo, where prices have fallen for twenty years and counting. The market there had the ability to absorb a significant amount of investors with speculative components to their business cases and not lead to a subsequent boom; in other words a lot of speculators got burned waiting for the recovery that was not. Indeed the Japanese property market remained rational longer than speculators could remain solvent. Not to say this will not happen in Vancouver, but convincing yourself it won't is a high stakes assumption nonetheless.
Second is that oversupply this time around may all but guarantee a return to fundamentals. There are just not enough people for the number of units being built and, worse, we have seen Vancouver's population "spread out" from past decades. That is, the ratio of occupied bedrooms to the total number of bedrooms has been decreasing for the past decade due to what I believe to be both a demographic shift, and historically low and lasting unemployment (due in significant part to the construction boom as it happens). What is to stop this trend from reversing when average wages are falling? If you think mohican's graph of CMHC units under construction is scary, wait until under-productive dwellings are brought back to more full productivity as people tighten their belts.
Third the past generation has seen a perpetual reduction in mortgage rates and mortgage qualification thresholds from their highs in the early '80s. This in turn has improved affordability for existing owners and pushed up prices for future ones who can still miraculously tap credit lines. That trend is unlikely to continue much further. If mortgage rates increase, it will be decidedly bad for affordability. If mortgage approvals are stricter, fewer can qualify to buy at all. And prices will suffer.
It comes down to one thing, that Vancouver real estate has had a lengthy CV of booms and busts with a distinct bias above what would be justified by fundamentals. As an investor, you may well be relying on Vancouver's house price volatility to ensure your overall returns are satisfactory. Food for thought, though, that THIS time, it may indeed be different, though not in a good way for your future savings. On the flipside, for families looking to buy a personal residence only at fundamental value, there is some chance you could be waiting a long time, though perhaps not.
Here I have attempted to paraphrase many of this blog's comments into this post. The information is not new, only presented. I do hope that readers, if they have time, read some of the comments here and in the archives for more insights into the fascinating subject of real estate in Vancouver, the "most bubbly city in the world".
The simple way of determining fundamental value is to look at an asset's current and expected future cash flows, discount them at your cost of capital, and sum them up. mohican uses a simple formula that I crudely derived here. There are other simpler and more complex methods of course and there is always disagreement over assumptions. With Vancouver specifically the last time properties were valued at what I consider to be fundamental valuation was around 2000 and before that in the mid '80s. Others will say 2000 was never at fundamental valuation, a local minimum that never quite reached the trigger point for them to consider it a good value investment.
The question is, if fundamental valuations have not been present since, say, the mid '80s, do they still have merit? The argument for why fundamental analysis is flawed for Vancouver real estate goes as follows. Real estate consists of cash flows from rents and capital appreciation. The Vancouver market has had many boom-bust cycles in its past. Even if an investor buys when prices are above fundamental value (not necessarily at the peak, mind), a subsequent boom cycle will allow the investor to exit with a decent overall return. Booms and busts are inherent to Vancouver's psyche. Given enough time, typically 7-10 years, you will always be able to cash out positive, the caveat being of course you avoid buying near or at the peak. Fundamental valuation is therefore rarely, if ever, achieved because investors anticipate future bubbles to compensate for poor rental yields.
In a nutshell, that is the argument. And before commenters rip it apart I will say that many people over the past generation have made decent real (or paper…) returns in this fashion. Most I have had discussions with do not engage in "pure" speculation (i.e. flipping) but actually rely mostly on rents for their return; "mostly" because for the return to really make sense they require some form of capital appreciation above inflation. The speculative component (i.e. prices above fundamentals) is apparently omnipresent within a typical investor's time frame.
The Vancouver price graph is indeed "biased" above fundamental value. So the argument goes, as I can make it out, you may have to wait a long long time for true fundamental valuations to return. If this is true, that Vancouver has a propensity for speculation, prices may never retreat to fundamentals in one's lifetime. In fact this is effectively the argument I hear on local blogs and amongst my acquaintances and family. Really they are saying that Vancouver is full of greater fools who will inevitably compensate us for poor cash flows or that their still fruitless but eternal hope of real income growth will manifest itself. And maybe they are right.
Of course speculation is a zero sum game and many we know have done well in the past generation in their real estate investments, "others" not so much. Here though I lob a few words of caution into the hubris.
First the assumption that Vancouver will experience another boom-bust cycle in most investors' time horizons is just that -- an assumption. There are precedents in other cities, most notably Tokyo, where prices have fallen for twenty years and counting. The market there had the ability to absorb a significant amount of investors with speculative components to their business cases and not lead to a subsequent boom; in other words a lot of speculators got burned waiting for the recovery that was not. Indeed the Japanese property market remained rational longer than speculators could remain solvent. Not to say this will not happen in Vancouver, but convincing yourself it won't is a high stakes assumption nonetheless.
Second is that oversupply this time around may all but guarantee a return to fundamentals. There are just not enough people for the number of units being built and, worse, we have seen Vancouver's population "spread out" from past decades. That is, the ratio of occupied bedrooms to the total number of bedrooms has been decreasing for the past decade due to what I believe to be both a demographic shift, and historically low and lasting unemployment (due in significant part to the construction boom as it happens). What is to stop this trend from reversing when average wages are falling? If you think mohican's graph of CMHC units under construction is scary, wait until under-productive dwellings are brought back to more full productivity as people tighten their belts.
Third the past generation has seen a perpetual reduction in mortgage rates and mortgage qualification thresholds from their highs in the early '80s. This in turn has improved affordability for existing owners and pushed up prices for future ones who can still miraculously tap credit lines. That trend is unlikely to continue much further. If mortgage rates increase, it will be decidedly bad for affordability. If mortgage approvals are stricter, fewer can qualify to buy at all. And prices will suffer.
It comes down to one thing, that Vancouver real estate has had a lengthy CV of booms and busts with a distinct bias above what would be justified by fundamentals. As an investor, you may well be relying on Vancouver's house price volatility to ensure your overall returns are satisfactory. Food for thought, though, that THIS time, it may indeed be different, though not in a good way for your future savings. On the flipside, for families looking to buy a personal residence only at fundamental value, there is some chance you could be waiting a long time, though perhaps not.
Wednesday, February 4, 2009
Fraser Valley Real Estate Market - January 2009
From the Fraser Valley Real Estate Board:
"A total of 389 sales were processed through Fraser Valley’s MLS® in January, a decrease of 59 per cent compared to 956 sales in January 2008 and comparable to January sales figures last seen in the early 1980s, according to statistics from Fraser Valley Real Estate Board’s Multiple Listing Service." Wow!


Prices in the Fraser Valley have been dropping now since May 2008 and prices are now back at July 2006 levels.

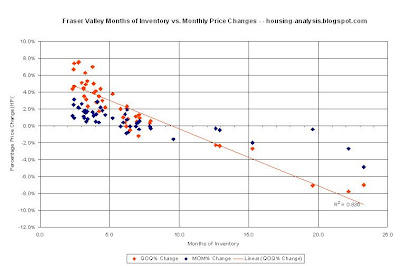
The correlation between months of inventory and price changes is exceedingly strong through the bust so far.
"A total of 389 sales were processed through Fraser Valley’s MLS® in January, a decrease of 59 per cent compared to 956 sales in January 2008 and comparable to January sales figures last seen in the early 1980s, according to statistics from Fraser Valley Real Estate Board’s Multiple Listing Service." Wow!
Active listings are really high for January.

Months of inventory is sky high to begin the year.
Prices in the Fraser Valley have been dropping now since May 2008 and prices are now back at July 2006 levels.

The correlation between months of inventory and price changes is exceedingly strong through the bust so far.

Stay tuned, more price declines to come.
Greater Vancouver Real Estate Data - January 2009
Greater Vancouver was still witnessing an unseasonably high level of real estate inventory as the first month of 2009 wound down. In fact, active listings rose steadily throughout the month after the large amount of expirations traditionally associated with the beginning of the year.

Sales were at the lowest levels not seen for over a decade. In fact, I do not have data going back far enough to see a lower sales month for January.

Consequently, the supply / demand metric that I like to focus on - Months of Inventory - is at an extremely elevated level to start the year. As you can plainly see, months of inventory typically rises from February/March through the fall. I think we can expect MOI to fall from this level during February and perhaps March as sales typically pick up, which changes the denominator of the MOI.

The correlation of quarterly price changes and months of inventory is still highly correlated.

The benchmark detached house price moved up by 1.7% during January compared to December and I must admit this seems a bit unusual given the extreme supply / demand pressure in the market. From month to month we can see deviations from the fairly solid relationship between Months of Inventory and price changes but on a quarterly basis there is much less deviation. I am looking for price changes to smooth out over a quarterly period.

I expect that the rise in the price attributed to January will be gone by the time we finish March. Over a three month period the correlation between Months of Inentory and Price Changes suggests that we will see a quarterly price change of -5% to -10% when MOI is around the 20 mark.

Sales were at the lowest levels not seen for over a decade. In fact, I do not have data going back far enough to see a lower sales month for January.

Consequently, the supply / demand metric that I like to focus on - Months of Inventory - is at an extremely elevated level to start the year. As you can plainly see, months of inventory typically rises from February/March through the fall. I think we can expect MOI to fall from this level during February and perhaps March as sales typically pick up, which changes the denominator of the MOI.

The correlation of quarterly price changes and months of inventory is still highly correlated.

The benchmark detached house price moved up by 1.7% during January compared to December and I must admit this seems a bit unusual given the extreme supply / demand pressure in the market. From month to month we can see deviations from the fairly solid relationship between Months of Inventory and price changes but on a quarterly basis there is much less deviation. I am looking for price changes to smooth out over a quarterly period.

I expect that the rise in the price attributed to January will be gone by the time we finish March. Over a three month period the correlation between Months of Inentory and Price Changes suggests that we will see a quarterly price change of -5% to -10% when MOI is around the 20 mark.
Subscribe to:
Posts (Atom)