Tuesday, March 22, 2011

Too Soon

Hello BBTL blog readership,

Although the market sold off in the last two days in line with my bearish-in-nature blog recently, and directly hit a January 19, 2011 cycle target, it is still too soon to declare any significant victory or trend - in either way.

Clearly, the short-term trend has become more difficult for the bulls. That much is certain. Yet equally, instead of the aggressive or panic selling one might expect in such an overbought market, the nature of the selling in the last two days was more akin to mild profit taking with some exceptions in individual stocks.

Can we conclude the top is in? No, not yet - at least assuming one is focusing on trends.

Shorter term swing trading on the other hand, involves a form of market gambling or placing calculated portfolio bets against an existing trend while controlling risks and usually with a superior understanding and experience level of financial markets.

Some, might pull the trigger here in such an overbought market, in a short side SP500 trade. Yet, clearly, even by today's technical analysis (as below) the upside risks remain. Consider alone what Ben Bernanke wants. Remember the market maxim, which once was a near biblical financial rule to never fight the FED. At least until a little more short side evidence rolls in, one should conclude that a sell short swing trade is still less than an ideal trade entry (risk) in the case of the SP500 index.

For the bulls, the NYSE market internals were actually mildly positive today. For instance, there were still almost 150 new highs and only 31 new lows on the NYSE; nothing the bears could write home about. Also, although the SP500 finished the day in slight negative territory, the upside volume eclipsed selling volume.

In short, the morning selling was fully washed out by an afternoon rally, even though commodities like gold have taken a significant hit today and recently. Hello overvalued commodities; has anyone told you about - deflation? Is no one watching the recent gold sell-off? It has been a leading indicator for some time, and yet lately, is looking outright bearish. By the way, the gold sell-off is very much in line with our expectation and gold forecast made months ago.

Those crazy bulls, which I recently renamed as pigs, have clearly not lost their all too-brave and too-stupid buying-the-top nature - yet. Also, the NYSE TICK chart (as below) is still in strong territory and there is no negative divergence in TICK. This implies the bears may need to remain patient a while longer. A few more short-term pigs may need to be taught a market lesson the hard way.

Despite the ominous onset of a longer-term bear EW count which this blog has been depicting for months,  the minor fifth wave may not yet be fully completed. Time will tell, yet such bullish markets as we have seen in December and January are statistically the exact types where Elliott extensions occur.

In cycles language, these are commonly referred to as cycle extensions. Therefore, a key forensic is to now watch and see - if key SP500 support levels are taken out. Later, bearish charts become more obvious with a series of lower lows and lower highs - if the downtrend is authentic.

On the other hand, and especially considering risk and money management issues as I have been discussing for some time, we can now firmly conclude that the market nature is slowly changing and becoming more bearish.

Essentially, social mood may even suddenly wake up here, and realize that there are many potential negatives in the economy, and especially one of the biggest potential shocks in 2011- higher interest rates - which I and most others believe will eventually come later in 2011. After such a prolonged period of abnormal near zero rates (engineered by the FED), the potential for a real interest rate shock in both equities and commodities is not to be overlooked - not to mention the economy.

You will recall, assuming you have been reading this blog, for many months now my overall market forecast and prediction for the SP500 was for significant top sometime in the first quarter. This predication still holds and is looking even more accurate given the last two days.

Given the irrational bullish exuberance and exceptional early-year rally so far in January, a more likely scenario now, is first to witness a bearish thrust down (initial shock), followed by one last bullish wave up, whereby the ignorant pigs bring the market back one last time as they line up to go to the financial slaughter.

This scenario, is also very much in line with some the strongest cycle targets I have in early March (or very late February), where a more major and final bearish change-in-trend (CIT) could occur. My final cycle target in the first quarter comes on march 19-20, 2011. How good is that, to have key cycle dates to watch for a CIT - in advance?

Further, as one of our astute blog readers and comments recently remarked, in a few more months the pressures will gradually build in 2011 on Central Banks to raise interest rates.

Then, as stated, the bond vigilantes will increasingly refuse to buy low rate bonds in a higher risk environments.  Also, there is an emerging inflation risk in bonds in 2011. With all of the global bailouts and accumulated government debt in the financial crisis, one inflation certainty for sure - is higher future taxes - which will really hit already constrained consumers hard.

But, to add another wild card, what about the potential of a USA dollar crisis if Bernanke holds rates at near zero too long?

Recently, as example, the USA dollar index has been relatively stable or even subdued in trading sessions. The focus is still on the Euro zone. Bernanke surely feels safe.

This currency scenario however, could easily and quickly change for the worse, as debt issues cross the Atlantic westbound, or as further competitive devaluations for trade purposes between the USA (and mainly China) are scrutinized by nations now being adversely affected.

Their tempers are clearly rising. Trade wars too are a reality. Just ask Brazil, which recently had some not nice words to say about the USA, and Mr. Bernanke's monetary policy which constantly competitively devalues the USA currency and causes other currencies to inflate in comparison.

On a purely cycle analysis basis, I did have a very strong cycle target in January and frankly about the 19th, 2011. So far, the change in trend now in January therefore is - on time. But I constantly ask myself, will the all-too-easy FED money and FED moral suasion of higher stock prices once again invert another cycle?

What I want to now see in order to legitimize being bearish about the current trend, and for all future trend determination, is for the two key support levels of 1261 and 1251 to be taken out on the SP 500 Index. Support levels near a major high when taken out are key forensic clues. Consider the gold chart, which has successfully already taken out several support levels.

I expect the next highest support level of SP500 at about 1261 must be tested soon (by Feb 04 latest) or else, we could see a 1300 - 1335 level before any final SP500 implosion or capitulation. Remember, pigs are greedy.

For now, perhaps the best advice for short-term traders is to be patient, and let the charts tell us the eventual short-term trend. My current guess is clearly down with sporadic ABC pattern rallies. Again, watch for any sharp upside reversal (more wave five to a recent higher high) or alternatively, any downside support levels being taken out (confirming the top is thus in).

Keep in mind that we are solely focusing on the SP500 Index. Individual charts are a completely different story and need individual analysis.

By example, the pigs recently buying F5 Networks were already slaughtered with about a 23% loss in just the last two days. In essence, some individual charts have already turned down from their major or significant tops. The highs for those charts for all of 2011 may well be in the past. Others stocks near record highs may still have room for final rallies. Again, I want to emphasize that every chart must be analyzed on it's own merit.

In summary, although I believe the very short term trend is now down, and that we will at least test the SP500 1261 - 1262 level soon, it is clearly too early to call a significant trend victory on either bullish or bearish side. We need more evidence.

However, one thing which I have been preaching a lot recently, still holds as true.

Overall this market is expensive, and we are absolutely near a major equity top in my viewpoint. Therefore, the basis of risks versus reward, I say raise cash, sell, or use tight stops.

Two charts are included below with my usual mark-up comments. Follow the trend, or if you consider yourself an expert, go ahead and swing trade. Both types of traders when proactive and savvy, use stops to protect capital to ensure their long term survival.

A lot of blogs close on the words "good luck" but frankly, earning a profit is a lot more about achieving and mastering market intelligence, financial education, discipline, and experience.

Spot the trend and go with it and forget what you read or hear. If you find yourself relying on hope or luck in your trading or investing, consider calling me personally for some needed one-on-one financial education, or personal financial tutoring. Consider it an investment in yourself.  


Financial education by the way, works far better than luck.


James Kelly Sr.,
Editor in Chief, BBTL Blog
www.KRTT.com
www.Facebook.com/KRTTcom
www.twitter.com/KRTTcom

Sunday, March 20, 2011

Gaps - Stock Market Manipulation ?

Hello BBTL Blog readership,

My posting is late this evening, and therefore my missive will be short.

However, do not be fooled or rush off as the three chart exhibits below are worth far more than any words could describe. I have said it before and will say it again; the only trend truth is in the charts. Spot the trend and go with it.

Moreover, financial markets work by Science and Natural Law; not by what any man says will happen.

Be Very Careful or Get Out

Also, my current position is well known and clearly stated. If you need to question my current equity market viewpoint, go back and read some of my recent postings.

However in a nutshell, my position is that until a more realistic equity correction is allowed to happen the markets are extremely dangerous. My message would include that if you are long and cannot take on considerable risk and losses, use tight stops. If you are smart you should avoid exposure to the considerably overbought indices - as the risks are simply far too high.

Likewise, on the flip side, with zero interest rates and the fact that Bernanke has added so much liquidity recently, he, as one of the most powerful financial men in the world is attempting to melt the US stock market - up.

Essentially, this is also a hidden message to warn anyone who dares to short stocks or the index. Another stock market implosion is not what Mr. Bernanke wants right now. He sees the world, and particularly the USA in rose colored inflation glasses.

So currently, the only way to be short stocks at present is with a dangerous swing trade (since the trend is still up and has not reversed - yet). Again, this makes the equity markets even more precarious, given that Mr. Bernanke and his close friends on Wall Street appear to be intervening in the markets. Today's sharp gap up at the open of trading, was another clue that market intervention by the PPT is alive and well. Yet, if they keep this up much longer, investors may soon have to rename Wall Street to Fraud Street.

Ask When and Why an Opening GAP Should Occur?

Back in the old days when equity markets were actually honest, not manipulated by our governments, and it was a far more level playing field, it was extremely rare that one ever saw an opening gap in a stock. Now there are hundreds - daily.

Generally, in the past, in order for the pro, or market maker, to GAP a stock up at the open of trading in the morning, there had to be something very significant happening - over night.

After all, if there was no corporate news overnight that was of a material nature, and thus no significant news or order imbalance, by deliberately opening a stock higher than the previous closing price, the pro could technically carry out and cause an act of illicit stock market manipulation.

Below, is a brief sample of the exact legal words used by one Canadian Securities Regulator (BCSC) regarding this manipulative act. The words used by the SEC, or any other regulatory authority should not be substantially different, assuming of course that the spirit and intent of the Rule of Law - for all - is being upheld.

By the way, this is not a unique problem in the USA, as these legal words and equivalent acts of manipulation are equally laughable in Canada, whereby when it comes to white-collar stock market crime and stock manipulation, Canadian regulation and enforcement are for all intensive purposes, non-existent.

Manipulation and Fraud
A person must not, directly or indirectly, engage in or participate in conduct relating to securities or exchange contracts if the person knows, or reasonably should know, that the conduct

(a) results in or contributes to a misleading appearance of trading activity in, or an artificial price for, a security or exchange contract, or (b) perpetrates a fraud on any person.

Yet, today at the opening of trading there were a huge number of US stocks, including many of those in the SP 500 Index - that gapped sharply higher - all on no overnight material news. Equally, there was absolutely no proof or any evidence that there was so much demand that a huge order imbalance existed to justify the opening gaps. In fact, trading volume today in most stocks was well below normal.

If stocks are thus deliberately allowed to gap up at the open of trading, without overnight news of a material nature, and without any order imbalance - than technically, it could constitute an intentional act of stock market manipulation - which essentially as a result - could perpetrate a fraud on society, and especially all those whom invest and believe markets are freely and fairly traded. 

Now imagine, what would it could say or imply, if that same fraud and manipulation was in fact being carried out or conducted by a fiduciary body - who was charged to oversee and protect the general public?

The logical conclusion is yours to choose. Possibly write to your local politician and demand a truthful answer that begins with auditing the large trades at investment bankers. 


Chart Truth - Spot The Trend


Stock Market Challenge - Are you a Market Wizard?

1. Astro-Sky Traders (Gann Astrology) - One of the most famous days in stock market history, was on October 19, 1987 when the stock market crashed. Is there any similarity in the Astro-Sky between October 19, 1987, and next Monday December 13, 2010. If so what is the similarity?

2. Market Geometry Traders - The Gann Box shown on the last chart today (SP 500 Index daily) suggests a near completion. Given the SP 500 Index April 26, 2010 high was about 225 days ago (time); what is the significance now, of a market move of (about) 225 SP 500 Index points (price) down, and essentially, then back up again in (about) 225 days?

Please note that there will be no formal answers given on our blog. However, it would be a nice idea to share your thoughts with each other via comments.

James Kelly Sr.,
Editor in Chief, BBTL Blog
www.KRTT.com
www.Facebook.com/KRTTcom
www.twitter.com/KRTTcom
Monday, March 14, 2011

Hoodwinking America Versus Chart Truth

Hello BBTL Blog Readership,

Bernanke Weekend Review

In a rare unprecedented action, the Federal Reserve Chairman Ben Bernanke took to the television airwaves over the weekend, in a deliberate attempt to defend the ongoing US Federal Reserve actions.

But, was Mr. Bernanke's intention this weekend sincere? Or alternatively, was this just a desperate attempt by the FED Chairman to hoodwink and calm angered Americans, to ensure the FED chairman will retain independent control over the secretive FED?

It is well known that in recent weeks Mr. Bernanke and the USA FED have come under increased scrutiny, criticism, and pressure, especially after the highly controversial additional $600 billion quantitative easing phase two (QE2) announcement. Mr. Bernanke has also suggested that his policies are raising the value of the US stock market, and that QE2 is not necessarily limited to just a $600 billion program.

The unprecedented amount of ongoing monetary stimulus created in the USA, is viewed by many critics domestic and international as unnecessary, and a dangerous gambit to decrease the USA currency further. Ultimately, critics say it is a highly inflationary move that will only ensure prolonged economic pain and even higher inflated prices into the future. Clearly, higher food and commodity prices are distinctly noticeable in recent weeks and months.

Worse and more recently, the US FED was forced by court order to reveal the fact that they had secretly given out over 21,000 loans all totaling over 3.3 trillion dollars since the sub-prime financial panic began.

The prime controversy over these loans was the very large amounts of loans given in hundreds of billions of dollars directed to foreign banks, and sources that would benefit foreign and USA competitors.Who gives such extraordinary power and discretion to a single man, or to a USA body that has been secret for decades and never audited?

My personal take on the television appearance having watched Bernanke this weekend, was essentially overall neutral. In other words, I did not substantially change any of my former views.

On one hand, Mr. Bernanke sounded sincere, and came across as an intelligent and patriotic American. Yet, he strongly hinted time and time again, that the unprecedented FED action was highly necessary, and that if the FED failed to act - it would be far more negligent and risky. Forensically, this comment of acknowledging high risk in his policies immediately acknowledges that the FED is deeply worried about the overall state of the USA economy.

Being a Keynesian intervening economist (versus Laissez Faire economics), Bernanke's central explanation seemed to be that the USA economy was borderline to a second or prolonged recession, and that the FED was compelled to act. He cited employment which up-ticked as recently as last Friday to 9.8% as a particularly troubling sign.

However, in my opinion having watched the Fed articulate their position closely for about two decades, most of the interview this weekend sounded much like the traditional perplexing and distracting FED speak that Greenspan and Bernanke are all too famous for.

From a pure economic perspective, anyone reading between the Bernanke lines this weekend would probably be alarmed about Bernanke's economic statements alluding to an economy that is potentially riding the cusp of another downturn. This could lead economically sensitive money managers whom were watching the interview, to commence selling stocks, or at minimum to lighten up portfolios.

My suggestion that Mr. Bernanke is hoodwinking America and my equal criticism of US politicians whom endorse such FED actions, is that monetary policy has been deceptively misused for decades. Why? Let me explain further.

Clearly, the FED has a primary fiduciary duty to protect the value of the monetary unit - above all else. To do otherwise, has obvious dire consequences for the entire nation. Both Mr. Greenspan and Mr. Bernanke have clearly failed this fiduciary duty to protect the US monetary unit.

Worse, the past easy money and prolonged sub-par interest rate policies of the FED have been foundational in discouraging savings, while at the same time allowing the gradual build up of excessive speculation, high inflation, and excessive systemic leverage on Wall Street and elsewhere.

Both the USA housing collapse and the Wall Street sub-prime collapse would have never happened in the first place, had the speculation and sub-par interest been checked by the FED raising interest rates and tightening monetary policy years ago.

Instead, the FED deliberately ignored monetary warnings, placed the USA monetary unit at massive risk, and deliberately acted to keep interest rates low. Therefore,  Mr. Bernanke's suggestion that the two back-to-back economic crises were caused by poor USA regulation, is misleading, abdicates FED responsibility for irresponsible monetary policy, and is at least convoluted logic that deliberately distracts attention away Mr. Bernanke's and Greenspan's fiduciary duty to lead the FED in a responsible manner.

It should be obvious for any professional economist, and for that matter even amateur investors, to realize that the low interest rates of the past, in such prolonged circumstances becomes particularly harmful to seniors living on a fixed income budget, while at the same time encouraging youth and all those with low incomes, to take up extremely bad habits of acquiring assets via borrowing and debt, versus a more realistic program of saving and hard work ethic.

Essentially, the greatest virtues of America's past success, by hard work and innovation, has been effectively swapped by the FED action of easy money, and leverage.  

Moreover, if the US wants to increase their global productivity and innovation, thus leading to real wealth, they will first need to put incentive into the proper perspective, which should begin with work ethic and a proper education.

In contrast to abusing monetary policy, under the convoluted guise of a necessary action to rescue the USA economy, what ever happened to the intelligent and far more effective use of fiscal policy and tax incentives for US businesses wishing to hire and employ USA citizens?

Fiscal policy and direct employment solutions provide a high efficacy solution, versus a risky, ineffective and indirect FED action which merely condones leverage and easy money, not a lot different that a ponzy scheme of debt and leverage that implodes on termination.

In essence, US politicians too have avoided their moral duty to oversee the FED, and become famous for unethical pork-barrel politics rather than finding efficient low-cost remedies for the poor and unemployed by applying proper fiscal policy to put their own citizens back to work.

In summary, the Bernanke and political suggestion that the use of monetary policy is an efficient tool to solve unemployment issues is clearly a deliberate deception.

To date, it should be increasingly obvious that trillions of dollars in US monetary bailouts and stimulus programs have done little or nothing to solve the plight, or suffering of the poor or the unemployed in the USA. In fact, since the beginning of the sub-prime meltdown, the gap between the rich and the poor has increased.

Finally, there has been little new or increased regulation and enforcement to prevent similar USA collapses in the future, and the speculative leveraging and packaging of securities which led to the immoral Wall Street sub-prime meltdown has gone unchecked and largely unnoticed. Not a single bank executive has been indicted or arrested, suggesting the rule of law overlooks the rich and powerful.

Further, Bernanke's core argument that deflation and lower prices are dangerous to the USA , or will lead to all out depression are largely unfounded and unproven. In fact, many would argue that lower food and commodity prices are exactly what is needed in America as a first step to recovery.

Although opinions and arguments over Bernanke's economic policies are world's apart, it is my belief that more risks are created by the current FED easy-money and inflationary money-printing policies. These policies have failed to serve the USA in the past and that evidence is undeniable.

Continuing to use policies that failed in the past will only ensure future failure and more inflation, an eventual lower USA dollar, and finally a lower US standard of living.

In the end, the lower and middle class Americans will be made to suffer further, higher taxes will be inevitable, and at the same time the rich and those employed on Wall Street with their large bonuses will attempt to retain control at all cost. After all, which Wall Street investment banker would want to sell their house in the Hamptons? Who could ever think of such an idea?

Chart Truth

As for the stock market direction, I strongly suggest to our blog readers that the current risk to reward ratio largely favors being bearish. Although I believe there could easily be another 5 - 10 points of upside in the SP500 Index early this week, the equivalent downside risk is likely ten times that amount.

Although the short-term trend looks to be up after last weeks rally, according to science and natural law, prices are similar to a mathematical rubber band, and when stretched too far have a tendency to snap back into place.

I also suggest reviewing the cycle hint given in our last blog post. Serious blog readers may further wish to calculate the middle of the time window given to arrive at a more exact date for a possible CIT.

As always, the truth is only found in the technical charts, for those that can spot the forensic evidence, and in doing so - spot the correct trend.


Therefore, this may be a good week to remember the BBTL trend following rule that the current trend is always your friend - unless it is about to change direction.

The chart below is indeed clear. Study it well and it should help you decide your next move.


James Kelly Sr.,
Editor in Chief, BBTL Blog
www.KRTT.com
www.Facebook.com/KRTTcom
www.twitter.com/KRTTcom

Friday, March 4, 2011

Bull Bears and Pigs

Hello BBTL Blog readership,

The markets were closed for Martin Luther King Day, and thus I took advantage of the extra holiday for further review and to post more of my most recent analysis. See the charts below.

Some of you were wondering about my fewer postings recently. The first quarter of 2011 is a very busy time for me, and therefore, I advise that my postings may be less than regular or frequent time intervals. Naturally, if something big, or a trend changing event takes place - that I have not already advised about - then, I will do my best to get a quick blog posting out.

As I begin my post today I want to point out that recently, I have received some sarcastic and ridiculing  comments posted on this blog (the offensive ones were simply deleted and now I have been forced to moderate comments) and further in recent weeks, even personal emails ridiculing cycle analysis and suggesting that I should throw in the towel, or capitulate, and become bullish as evidently some other blog or analysts have.

The emails and some blog comments thus suggest the blog postings are outright wrong, and in essence worth no more than trash. Given that this is a public and open blog, I have elected to make this topic open  for debate and further comment, as opposed to keeping anything hidden. In essence, this is a request for comments to our blog readers, especially if your have read this blog for several weeks or months.  

Yet, let me suggest to you now - that sending in such emails or posting such comments on this blog will not change my market mood anytime soon. I also believe changing my market mood (cautious if not outright bearish on certain financial instruments recently) is not even in your best interest as readership.

Assuming most blogs were outright bullish, as some have emailed and suggested to me, then this blog would provide a very good balance.

However the core or my cautionary argument, and our discussion herein this evening may be more about money management and market logic, than simple trend following . Read on.

But on the other hand, having now started this blog which can be seen by global masses and a variety of individuals, I too have learned a valuable lesson about human nature.

Therefore, as a warning and before I begin tonight's blog, let me officially go on record to say and warn to those whom see fit to send in outright hostile, or stupid criticism in an effort to waste my time, or in some vain attempt to ruin the learning experience here for others, that I may at my discretion temporarily, or permanently, ban your IP address if you get stupid.

Naturally, this warning pertains only to a small fraction of our blog readership that seem to refuse to act and write civilly.

To most of you as readers, it is probably already inherently too obvious, that some people while using the internet, believe that since they believe they are hidden, or can remain anonymous, they thus have unlimited power to feel free to say, write, or do anything at their own will.

The internet and use of this blog is a privilege to all, and I remind everyone that democracy and the internet, and this blog included, is not a right to do or say as you want - but rather as you ought.

If the hostile comments, sarcasm and ridicule issue became problematic, I might also elect to password protect the blog in the future. Worse, I would do a paid-only blog which I already know is feasible given the content I can post.

Therefore, please remember to act and write your messages to me or this blog accordingly.

This means - think carefully before sending this blog or me personally verbal attacks including sarcasm or ridicule emails, and posting stupid comments on this blog. I do not suffer fools gladly.

Back onto the more important topic of this financial blog, while acknowledging the bulls have been correct in the short term, and that the bear may need to be patient a while longer, there are several very real problems I have with being bullish at present.

Moreover, if you have followed the blog in detail over recent weeks, you would already essentially know all of the following that are highly problematic with being a bull:

1. The Elliott Wave (EW) Count of a coming fifth wave is bearish. The longer term EW count for 2011 could in fact be quite ominous, and to add complexity at present, I am working with both a primary or preferred EW count, but also, a secondary count.

The two counts were recently explained and both are near term bearish. I have already pointed out that they allow for minor amount of upside room. Assuming the market illusions of grandeur continue, and the pigs continue buying, or that the market is being manipulated higher by hidden forces, I want to acknowledge that the SP500 may even reach the 1335 level.

Yet frankly, that would not make me necessarily wrong (assuming you follow my market logic) but only serve to make me more bearish using the EW and other theory involved in that same market logic.

2. Consider that at present and for some time, there are considerable negative divergences in technical indicators (the new high-low ratio posted below is yet another example). Although negative divergences do not tell exactly when a correction might occur, and markets can tend to stay overbought for prolonged periods (as they are now), my experience has taught me not to ignore these negative divergences.

3. Additionally, I have repeatedly discussed the ongoing possibility of outright market manipulation. This was made even more obvious (as a matter of fact) given the FED 's aggressive monetary policy and moral suasion even to the point of a Bernanke December TV appearance.

Expressed using cycles - and as I have also taught here of man-made upset mechanisms (which temporarily change or invert natural cycle trends), a cycle inversion has now likely taken place due to this Bernanke FED policy of QE2 - and the current highly abnormal FED monetary policy of near zero interest rates for a prolonged time, which eventually I believe will pose more problems than solutions.

4. Finally, after going bullish on this blog at the beginning of September, and for several months now I have stated on the blog that I expected a significant market top in the first quarter of 2011.

So far, that same forecast made months ago continues to look and potentially be very accurate. The first quarter is not over and time will tell.

Yet frankly, some of you have asked or prodded already that I should capitulate and change based solely on greed or what I see as buying close to a top. It would be extremely foolish, if not outright stupid, to tell everyone to get bullish just a few days, or even a few weeks - from a major market top.

My caution in recent weeks is in essence, to prepare our readers of my views in advance of that potential major top, as opposed to telling you all - after the fact.

Although I do not usually talk of specific cycle details, KRTT has in it's possession and applies considerable advanced cycle work in making many of our market projections. This included the projection of a top in Q1 or 2011. Our blog has already featured some interesting and educational cycle education in both Fibonacci and even Astro Cycles.

This cycle inclusion in that regard makes this blog absolutely unique and far more valuable.

At present, there are several prominent cycle targets within the first quarter, that I am now looking at.

For instance, one important cycle target comes later this week about January 19-20th, 2011. Another comes in early February.

Last but not least, and for the record, I was there advising friends and clients to buy when the SP500 was 666 in March of 2009, and was also there advising this blog to buy the SP 5090 1010 low of late August, and early September. Moreover, I was getting bullish using an analytical swing trading approach in advance.

Again, the idea to make and generate a profit is by beginning with a lower risk entry point, and therefore in essence to buy the lows, and not to revert or be forced to buy the highs or even adopt a higher risk entry point - solely based on greed.

So, for you persistent bulls that those that believe all trees grow to heaven, and to all those that wish to aggressively say in emails or sarcastic comments and whom want me to now capitulate, I say to you; go ahead and buy here.

Equally, let me also suggest to you that you may wish to consider learning the old market maxim about bulls, bears and pigs.

Bulls and bears have a far longer life span on Wall Street and Bay Street. Yet they are frequently wrong, but nonetheless have some basic market intelligence. Their wounds over time will teach them to increase their market knowledge and education. As a result the best animal on Wall Street is the hybrid bull-bear.

On the other hand, the greedy pigs whom usually laugh at both bulls and bears, appear to be very stupid financial creatures, and often aggressively buy the tops (or sell the bottoms). Usually, as a result the pigs soon go to the slaughter.

Expressed more simply, the equity market as measured by the SP 500 has statistically outperformed dramatically since late August 2010, (when I turned bullish after the summer correction) and done so in the middle of a highly questionable economy.

Longer term fundamental analysis such as PE ratios (an excellent tool used by value buyers) also now suggest that the current North American equity market is extremely expensive and thus highly vulnerable - especially if the market mood or the economy should reverse or worsen.

I believe that more than anything, the major explanation for all of the the most recent bullish events is solely being fueled - not by sound market logic - but rather is being driven by a highly risky US FED policy that will someday probably cause considerable angst.

There should be no secret that the Central Bankers globally, and especially the Bernanke led FED, are intent on monetary policy intervention tactics that have created and fueled a boom-bust economic cycle - time and time again.

After all now months later, there has been NO realistic equity market correction for some time.

This is now statistically abnormal. Therefore at the very minimum, I would want to see some form of more realistic sell-off before I became anything even close to bullish. Again, market entry points are made on lows - not highs.

Finally and perhaps most important, this commentary relates and applies only to the SP500 index, although as I have pointed out several times, there is also a high correlation to certain other global stocks and indices. Frankly, on certain equities and asset classes and even selected economic sectors, I am outright bullish.

Lessons Learned

The entire concept of money making and profit, in any investment or trading forum, is generally to buy low and later - to then sell the high. Unfortunately, human emotion (especially fear and greed) and usually a distinctive lack of financial education, make this very hard for some to achieve.This is exactly what this blog attempts to educate on.

Also keep in mind for you own capital protection, that there is no 100% accurate market advisory in existence.

Some of the sarcasm and ridicule comments mentioned above, and that I have reviewed look extremely foolish, or depict a highly amateur or unskilled nature.

Moreover, as I have taught before on this blog, it is only a matter of time and experience, when one day a trader or investor wakes up and realizes and fully comes to understand, that to be a savvy financial professional, or even a good amateur trader, will requires placing risk management and risk determination, first and foremost.

This means risk and overall market risk, as well as trade or investment risk must be assessed well ahead of any feelings of greed or a desire to profit. Once in a trade or investment, the market dynamics will also require ongoing risk management. In that regard, what some of you may see as wrong, is essentially my personal views towards pro-active risk management.

Those however still wishing to convert or change this blog, or those whom believe or want a 100% percent accurate financial blog written while using simple trend following - is also not a problem. Actually it would be very easy for me to generate.

After all, a trend following approach is simply generated after the fact.

I know of one such paid sight that has thousands of paying subscribers. Is that what you really want? Trend following is also one of the first tools and most basic technical tools and market techniques taught by me (and KRTT).

So if you wish, go ahead and cast your votes. Speech now or forever hold your peace. Frankly and again, it will also be a lot less time consuming for me to generate and publish such a simple trend following blog.

Here is what a simple yet 100% accurate trend following blog might look like given 100% after the fact accuracy. Is this what you really want?

5 day trend - up
14 day trend - up
60 day trend - up
200 day trend - up

This is easily set-up even by an amateur investor with little experience, using the most basic form of spread sheets, moving average, or more accurately by applying mathematical regression analysis.

What this blog attempts to teach and educate on is a great deal more.

In my own personal opinion, this blog takes you as a reader, or as a financial student or hobbyists, or even as a financial professional (we have a few pros and even portfolio managers that read this blog) far beyond the obvious real time trend-following market advisory service as provided here on the SP500 Index.

Yes, this blog uses and has adopted a swing trading and far more difficult - forecast in advance - approach. Then going much further, it attempts to generate and create the highest quality financial education on a wide number and range of topics that I have decided to teach the public .

Is it valuable? That is up to you the readership to decide? Naturally, I would enjoy receiving every readers feedback.

Finally, for the vast majority of our silent readers whom usually do not post on this blog, perhaps more of you should join into the comments section, and if you wish, make positive or realistic suggestions for change.

As I promised more of our ongoing analysis - here are three updated charts which have my usual mark up comments. They are self-explanatory.


James Kelly Sr.,
Editor in Chief, BBTL Blog
www.KRTT.com
www.Facebook.com/KRTTcom
www.twitter.com/KRTTcom

Tuesday, March 1, 2011

The Crystal Ball versus Bernanke Sandcastles

Hello BBTL blog readership,

In the last update, I discussed how to apply simple market geometry (a form of Natural Law) by using the highly visible pivot-point from the sub-prime panic low on March 6, 2009.

At that crisis low, the date (time) was March 06, 2009 and the SP500 Index bottomed at about the 667 price level.

Then, using this time and price pivot, we derived a new harmonic time and price target to expect a change in trend (CIT) that is immediately ahead of us.

Natural Law Market Geometry


Another key concept beyond fractal geometry is a key concept about W.D. Gann's 45 degree angle (one unit of time equals one unit of price) whereby time and price can harmonically interchange with each other.

When this time-price harmony occurs, and especially when it can also be verified by other cycles or natural law theory, a high probability change-in-trend (CIT) is possible.

Additionally, in this example, we harnessed the power of a basic yearly cycle.

Seasonal cycles as they are also called, are amongst the simplest to understand annual cycles. Nonetheless they are still very powerful. Farmers and the financial commodity market participants were the first to observe, utilize and rely on seasonal cycles in their trading.

In a nutshell, if a key event happened in mid August, it created an anniversary or cycle date the following year in mid August according to seasonal cycles.

So, in the last update I pointed out, that according to a near perfect time-price geometry target using multiples of two, as we approach early March 2011 (an anniversary date of the sub-prime panic low) it provides us an approximate SP 500 Index target of about 1334 (667 times 2 or about two times the crash low).

Equally, and at the same time, we are approaching this two times price level at exactly the two year point. Therefore the multiple of two becomes interchangeable.

Again, if time and price are interchangeable, they must be harmonic and be following a Gann angle of 45 degrees. We can also note that two, is a Fibonacci number, and given the approaching anniversary date - seasonal cycles are also involved.

In that last blog, I further pointed out two slightly different methods of calculating time.

The first was using our standard calendar years of 365 days. Two years from the March 6, 2009 panic low would then work out to a time target of March 5, 2011.

However, I also demonstrated an alternate time system based on a 360 day cycle, which would cause the time target to shift forward by ten days to a target of Feb 23, 2011,  assuming one counts both the first and last cycle day.

Although no one has a perfect crystal ball, cycles and Natural Law clues provide us incredible insights and clues into how the financial markets really work.

Elliott Wave Adds Value

As we firmly attest and teach here on this blog - the financial markets work primarily according to Natural Law - exactly as the great W.D. Gann alluded and taught over one years ago. The research work that I have completed over decades, has not only proven that Gann was correct (and obvious financial genius for his era), it has further proven alternative natural laws as viable and valid, beyond those which Gann studied.

As we also have Elliott Wave aficionados visiting this blog, I thought I might briefly introduce how to apply a simple EW pattern as another forensic Natural Law clue, to assist new Elliott Wave students to improve their predictive ability to see market tops ahead.

Remember that many forms of Natural Law are predictive in nature, as we have clearly proven here.  This does not necessarily mean that one must use such powers as a swing trader going against trends. Many of you should continue to be trend followers.  

I begin by first stating, that Elliott Wave is another form of Natural Law. It involves repeating patterns or cycles. Although many EW teachers make Elliot Wave very complex, the predictive power is normally found in it's simplicity.   

This however assumes there is no cycle inversion(s) or Elliott Wave extension(s), which by definition are rare events. At present this is hotly debatable, especially given the tremendous intervention of Central Bankers in recent decades. These as I have pointed out, are Man-made upsets (specifically upset mechanisms) that deliberately interfere with natural cycles.     

So, we need to acknowledge and to thus point out or teach, that the classic Elliott Wave patterns leave definitive forensic clues of an impending or imminent top. How?

Some of you already probably know this basic EW theory, as is characterized by the EW 4 wave. But did you also know that W. D. Gann knew of this same four wave clue, even before Elliott? 

Essentially, in a prolonged bull run - just before the final peak - there is usually a sharp counter-trend correction down which is called wave four.

The Elliott Four Wave is therefore a warning that should be acknowledged or even feared by all bulls, because frankly, it is the final signal or forensic clue in EW theory that a trend may soon change direction.

Fortunately, there is still a little time left in the primary up trend, as the bulls in their ultimate greed will see this as another opportunity and reliably take the market back up - ONE LAST TIME in what is called the final wave five. There are many clues to spot a terminating and final five wave, but these are best left for another day and topic.

At this terminating point, the former up trend or longer cycle, and thus the buying pressure becomes totally exhausted , and the market capitulates by turning down in a major change in trend.

Although I cannot go into details on individual stocks withing the SP500 Index, I will say or remark that several stocks are now or have already experienced this Elliott Wave Four Down - as a forensic clue of a final top.

This means these stocks are now making what looks to be their last or final fifth wave rally up.

One such stock that has a clearly defined recent wave four down is Juniper Networks or JNPR on the NASDAQ.

See the JNPR daily chart as below. Can you spot how Juniper has a clearly defined wave four down that is now complete. The chart below and this previous wave four down forensic clue, now implies that Juniper Networks is in the final fifth wave rally (also within a larger scale wave five). This implies that Juniper Networks is extremely close to a very important change in trend (CIT) or reversal to a new down trend.  


Although most of you probably are not aware of this, besides R. N. Elliott, the great W. D. Gann also realized and recognized the power of this forensic sell-off clue just before the final top rolled over.

Gann called this same Elliott Wave four or last counter-trend - the over-balancing of price.

In summary, we should acknowledge that by applying market geometry and our previously calculated time-price target, we now are very near this potential important and final termination point (assuming no cycle inversion or Elliott Wave extension).

We also should be watching over the next few days to see if we can spot any wave four sell-offs (even in a small or minuette EW pattern) in advance of a final SP 500 top or even in advance of a top in our favorite financial instrument that might closely correlate as we demonstrated with Juniper Networks.

Bernanke Sandcastles - Mission Accomplished - High Inflation

Only a fool would deny that there is a very significant danger in the current USA stock market.
Consider the bellwether SP 500 Index.

The SP500 index consist of large-cap blue-chip USA equities that invariably are mature companies, and as such, are not normally known for their high growth rates.

Yet in the last two year, the average SP500 stock has now returned 50% per year. Expressed slightly differently, the SP500 index has doubled in value in just under two years.        

This type of equity rate of return in mature USA companies highly statistically abnormal - if not absurd. It also begs the question - why?  How can anyone explain such huge and abnormally high returns in large-cap mature USA equities?

To find another such similar era of highly abnormal USA bull markets returns, Wall Street statisticians will have to look back over 75 years. This statistic alone tells us we are now living in a rarefied equity delusion that will not last. Yes, only once in modern equity history (looking back about 110 years) did such a huge return happen. It was in the 1930's.   

Let us consider the previous era that such abnormally bullish stock market performance also took place. Again, it was in the 1930's.

Looking back at that time, it was the onset of the Great Depression and after the famous crash of 1929. Wall Street and America then too attempted to deny or marginalize the economic depression by inflating stocks abnormally after the 1929 crash.

What happened then? Well, after that enormous stock market dead-cat-bounce of the early 1930's, stocks crashed again. The second time, this crash of the 1930's was far worse. People slowly came to realize that the Depression was in fact - real. In the end, it took until the 1950's for stock prices just to even break even.

So, we should all be asking; is this equity market rally real? Or, is it based on something artificial  - like a sandcastle - that will soon crumble under new tidal forces.            


Mr. Bernanke and his Wall Street and FED friends take credit for this stock rally and also the so-called return to USA economic health. After all, something should have happened as we just witnessed, the greatest expansion of money, corporate bailouts, and global stimulus programs in history. But at what cost?

One might even begin to think that the USA is on the dawn of the greatest economic boom in USA history by such massive USA stock returns. Now that too is an interesting topic.

How can any mature economy like the USA - have the biggest global stock market returns? After all, all around the globe emerging economies and new giants (India, Basil, China etc) are nipping at the USA economic heels.

Even, in the recent political turmoil in Egypt - virtually most global stock indices sold off - some sharply. But not the USA or SP500. Is this just more of Bernanke or PPT manipulation. Or is it irrational exuberance?     

Alternatively, one might falsely conclude that the USA housing and sub-prime collapse never really happened.

Mr. Bernanke might have us all believe that it was just sugar-plum fairies dancing in our heads. Yes, according to the breaking news at the FED - the housing and sub-prime crash was just a figment of our imagination.             
Mr. Bernanke and his banker (some read this as bankster) friends on Wall Street and at the FED, have obviously prolonged and over-stimulated the USA economy, (and now also the stock market) by quantitative easing, a loose and easy money supply at the FED credit window, and the prolonged near-zero interest rate policy.

Yet frankly, this is an artificial monetary policy and economic situation that must soon change.

No equity bull market can last forever, and stock returns of this nature are artificial. All trees do not grow to heaven as the FED might lead one to believe.

Stocks that go up too much or too fast have a nasty habit of  snapping back or clawing back abnormal returns. Are you ready for that?

In a nutshell, highly abnormal monetary policies are similar to sandcastles. They are bound to change and wash away as stronger tides and new forces or new economic dynamics take place.

So let us not all act like delusional fools. Also, we need to ask what are the true costs? Those that could lose the most in the future - will likely be the most naive and the least informed.    

For recent Bernanke FED comments click here. 

Many Americans might endorse, or even praise Ben Bernanke for his monetary and economic prowess and the many deliberate FED led programs to bail out and stimulate an otherwise fragile USA economic situation.

Yet more truthfully, even a simple minded and basic American student of economics, should being asking many questions and possibly see this as the monetary hoodwinking of America.

At minimum it is totally unfair (it helps some and not others and it mainly helps the rich) and at worst, it it an outright dangerous policy of inflation and a planned devaluation of the currency.

One easy to spot Bernanke monetary flaw, is his outright repeated demand to fight deflation. What is so wrong with cheaper prices at the pumps, the supermarket, for cars or at the mall?   

To fight deflation one prints money and deliberately creates inflation by massive monetary injections, programs such as QE2, and an obvious continued and prolonged near-zero interest rate policy.

Yet, Ben Bernanke denies that he or the FED policy (or other Central Bankers with similar policies) are  responsible for higher inflation. This is being coy and frankly evading the real truth.

When cornered on this higher inflation topic, Mr. Bernanke immediately implies higher prices are merely a supply-demand economic demand pickup, suggesting his policies are really working.

Yet , how does higher inflation impact the average American? 

Also, any armchair economist cannot help but point out that Ben Bernanke and the USA FED are at the same time deliberetaly engineering both higher inflation and a lower USA dollar.

Given that most Americans, if properly educated would want a higher USA dollar (as opposed to a lower dollar) to prevent the erosion of their buying power (and also the lowering of their standard of living) one must ask where does this foolish support for Ben Bernanke comes from?

Although more complex to economically discuss (we'll save it for another day), this could also be construed as Bernanke and the FED are now deliberately engineering the greatest wealth transfer in history (out of lower and middle-class America by a hidden agenda to devalue the USA dollar) while creating inflation that is higher than it otherwise would have been .

Well, I say a very BIG congratulations should now go out to Mr. Bernanke and his Central bank friends!

They have exactly accomplished their mission in spades as one money manager in California stated. Everyone reading this has seen the higher food and commodity inflation. This was all part of Mr. Bernanke's deliberate plan. He has purposely rigged markets for higher inflation and also a devalued dollar.

World inflation is now swimming in a sea of red hot inflation according to the Wall Street Journal.

Instead of ending the former crisis intelligently by raising interest rates to stop leverage and speculation; Mr. Bernanke, and the FED, have been busy engineering a new crisis in the making.

Check out the sea of red global inflation (click here to open the link) - thanks to helicopter Ben. If you think this is the end - you might just be hoodwinking yourself. The fallout from Mr. Bernanke's deliberate monetary inflation engineering may be just the beginning

See also the three charts as below for our traditional follow the BBTL truth of trend and technical chart update, with the usual mark-up comments.


James Kelly Sr.,
Editor in Chief, BBTL Blog
www.KRTT.com
www.Facebook.com/KRTTcom
www.twitter.com/KRTTcom

Monday, February 28, 2011

Cycle Alert

Hello BBTL Blog readership,

Market Mavens and Financial News are Often Wrong

The update tonight is straight forward, short, and largely reiterating my ongoing short-term equity market caution, in spite of the nominal advance in USA stocks today.

Again, I caution that it is futile to follow the daily financial news, or to put too much emphasis or faith into the stock market action of a single day. This is truer when the price move is small (an inside day) and on low volume (which suggest mere volatility).

On the other hand, when prices breakout strongly from a previous trading range, and do it on massive volume such as in the case of Eastman Kodak today, there could be a lot more happening in the forensic price and volume clues.

What I am suggesting is that by watching for high volume large price increases, it has far more trend significance than the financial news. Ask yourself, what was the huge financial news in Kodak today that caused the huge price move in Kodak on multiples of normal volume?

By example of useless and distracting media noise, the recent Obama announcement of the ongoing tax haven hiatus, or more handouts to the unemployed, have led some USA economists and many media sources (including financial behemoth PIMCO) to suggest this is a very welcome stimulus beyond a mere monetary carrot, that potentially is a game changer for the economy, indicating more robust growth ahead.

The financial media while looking for the hot story daily, instead of understanding the real trend truth of Natural Law, or being alert to tired trends and cycles, immediately determined the Obama announcement is why USA bonds fell so sharply in price this week. Bond prices always go down (and yields up) on strong economic news, or particularly higher inflation, - right?

Yet frankly with US bond prices falling this week due to a story of a better coming economy, or  possible higher inflation down the road as a result is convoluted and far from guaranteed. Has the past trillion dollar stimulus moves helped unemployment?

Or ask why, at the exact same time this week, (which is supposedly inflation sensitive) did gold get hammered and also fall sharply? So essentially gold and US bonds were strongly at odds. Which one is telling the inflation or deflation truth? 

In summary the daily financial media hype, although newsworthy and potentially interesting to some, is not indicative of the trend truth (except in rare cases we have described in the past).

The road to profit is always by determining the current trend.

This can only be properly accomplished by technical analysis - or as I call it; the new and emerging science of trends and cycles using advanced technical analysis.

Remember the old financial maxim that the trend if your friend. Spot the trend and go with it.

Cycle Alert

Having updated several cycles this week, I have slightly extended the previous discussed cycle hot-spot or time window for a possible change in trend (CIT). The current cycle hot spot for a CIT is amended to Monday December 13, 2010 until Wednesday December 15, 2010.

Chart Truth

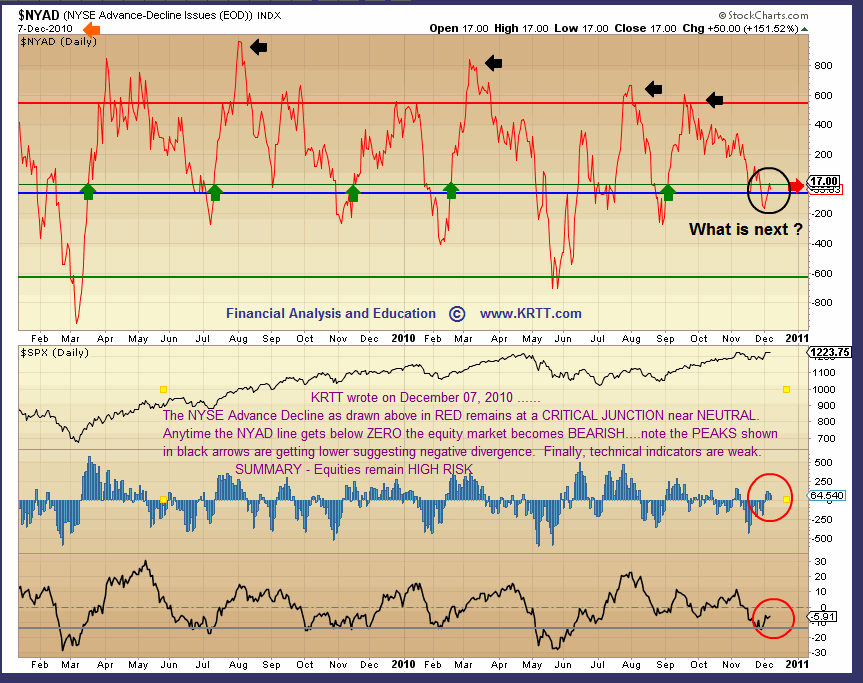
Two technical charts exhibits below relating to the SP 500 Index and the NYSE new High Low Ratio are largely self-explanatory and reiterate caution.

Astro-Sky Exhibits Below

A few of our blog readers have sent me their personal responses to the Astro-Sky Challenge in our last blog. At present, no one is close to what I was hoping to demonstrate. As a result, I have posted the two Astro-sky dates as below using a geocentric layout, to ensure that everyone is using the same tools.

If you wish to comment, rather than writing me directly, why not help others by posting your answers in the comments area. There is no wrong answer as you are only sharing your observations.


James Kelly Sr.,
Editor in Chief, BBTL Blog
www.KRTT.com
www.Facebook.com/KRTTcom
www.twitter.com/KRTTcom

Friday, February 18, 2011

SP 500 Chart Update

Hello BBTL Blog Readers,

As my time is very limited this evening, I am simply updating with three charts of the SP 500 Index in different time frames.

By far the most important chart is the weekly chart shown first, since it updates the bigger equity outlook picture.

By the way, this chart format is the exact same chart format last posted here on December 01, 2010, on the blog and also posted earlier in November. As you may recall, we used this format to discuss and forecast the Fibonacci event, which now in hindsight was a bullish market acceleration up after a truncated wave four correction. That event was on time as scheduled about December 01, 2010.

Notice on this weekly chart a NEW ELLIOTT WAVE COUNT.

To err on the side of safety, the weekly chart now depicts a more conservative and far more bearish count of now being in the fifth of the terminating fifth.

The alternate count (also still valid) is that we are currently in the third of the fifth (with the logic that the third wave has now extended - also called an EW extension).

Also, on this weekly chart, you will further note, that I have depicted the next scheduled Fibonacci event on the FIB Ladder.

This now suggests that by applying our current overall market logic as posted on our blog, a serious correction should commence in the last two weeks of January 2010, or very early February if just one week late. This allows for a margin of error, of just one week early or late.

The daily and one minute chart posted below are self-explanatory and have my usual mark-up comments.

QUESTION and ANSWER

On the last blog a comment was asked if this so-called manipulated rally could last until March. I thought the answer might be useful to all so I am responding here on the main blog.

My answer is naturally yes. Anything could happen. Moreover, I again say that my own forecast made months ago was for a final and important top within the first quarter of 2011.

Moreover, speaking of manipulation, after all I do not have a red phone connected to Mr. Bernanke or the Plunge Protection Team. Having stated that with a degree of sarcasm, that is not what I expect to happen. As I mentioned in the weekly chart upcoming Fib event, later in January (or even very early February) there are some important cycles for the current market to overcome.

Although I generally do not discuss cycle details here in the blog, these important near-term cycles include no less than three distinctive categories of cycle events such as Astro cycles, Fib cycles (see the weekly chart included here), and even Gann time cycles that in this case fall very close to each other in time later in January.

There are also two important points that some of you may have missed or have failed to learn.

This BLOG uses a SWING TRADING FORMAT versus a TREND FOLLOWING approach. This is one of the main reasons why this blog if far more valuable and useful to the readership. That should be self-evident, but if it is not obvious, then perhaps ask me to explain later as time permits.

Secondly, the first rule of money management is not to lose capital or expressed differently, to take on stupid or excessive risk. I repeat, that in my viewpoint, the current market risk to reward at present is extremely poor, and by my estimation is at least 4:1.

In summary, trade what you see on the charts and not what you think or hear. The charts posted today have many clues and insights.


ERROR CORRECTION - The 1 minute chart above should read.....driven by futures "BUY THE OPEN PROGRAM TRADING" ....The market remains expensive, heavily overbought, and likely being manipulated by large or deep pockets - THUS SELL OR USE TIGHT STOPS


James Kelly Sr.,
Editor in Chief, BBTL Blog
www.KRTT.com
www.Facebook.com/KRTTcom
www.twitter.com/KRTTcom