Showing posts with label history. Show all posts

Monday, August 30, 2010

What a Difference 5 Years Can Make

Time Magazine cover stories are marvelous contrary indicators.

Time Magazine cover from June 13, 2005.
Time Magazine cover from September 6, 2010.

Thursday, November 26, 2009

Teranet: September 2009 House Price Index

A smaller but still robust monthly rise

Canadian home prices in September were down 1.8% from a year earlier, according to the Teranet-National Bank National Composite House Price Index™. It was the tenth consecutive 12-month decline, but the 12-month decline has been diminishing steadily since it peaked at 6.9% in May. The reason is that September was the fifth straight month in which the index reading for Canada as a whole was up from the month before. The September monthly rise of 1.3% was the smallest in four months but still vigorous. The vigour is consistent with an improvement in market conditions over 2009 to date - more homes have been selling and fewer have been coming on the market.

Teranet – National Bank National Composite House Price Index™

Contact Us

For general enquiries:

simon.cote@tres.bnc.ca

For licenses covering all index-linked products, please contact:

Simon Côté
simon.cote@tres.bnc.ca
514 879-5379

For the first time in three months, prices were down slightly from the month before in one of the six metropolitan markets surveyed, Montreal (−0.2%). This decline was not due to a deterioration of market conditions. According the Greater Montreal Real Estate Board, home sales were up from a year earlier in every month from May to October while new listings have declined. Toronto prices were up 1.5% from the month before, the smallest increase since the April bottom but still substantial. If October shows the same rise, Toronto prices will be back to their peak of August 2008. As for the other four markets, the September monthly rises were 2.1% in Vancouver, 1.1% in Calgary, 0.9% in Ottawa and 0.6% in Halifax.

The continuing 12-month deflation of the composite index (−1.8%) is attributable to three of the six markets: Calgary (−5.4%), Vancouver (−5.1%) and Toronto (−1.0%). In the other three markets, prices were up from a year earlier: Ottawa (3.4%), Montreal (2.9%) and Halifax (1.7%).

Teranet – National Bank House Price Index™

The historical data of the Teranet – National Bank House Price Index™ is available at www.housepriceindex.ca.

Metropolitan areaIndex level
September 2009
% change m/m% change y/y
Calgary154.321.1 %-5.4 %
Halifax123.580.6 %1.7 %
Montreal126.05-0.2 %2.9 %
Ottawa121.490.9 %3.4 %
Toronto115.541.5 %-1.0 %
Vancouver141.852.1 %-5.1 %
National Composite127.891.3 %-1.8 %

The Teranet–National Bank House Price Index™ is estimated by tracking observed or registered home prices over time using data collected from public land registries. All dwellings that have been sold at least twice are considered in the calculation of the index. This is known as the repeat sales method; a complete description of the method is given at www.housepriceindex.ca

The Teranet–National Bank House Price Index™ is an independently developed representation of average home price changes in six metropolitan areas: Ottawa, Toronto, Calgary, Vancouver, Montreal and Halifax. The national composite index is the weighted average of the six metropolitan areas. The weights are based on aggregate value of dwellings as retrieved from the 2006 Statistics Canada Census. According to that census1, the aggregate value of occupied dwellings in the metropolitan areas covered by the indices was $1.168 trillion, or 53% of the Canadian aggregate value of $2.207 trillion.

All indices have a base value of 100 in June 2005. For example, an index value of 130 means that home prices have increased 30% since June 2005.

By:

Marc Pinsonneault
Senior economist
Economy & Strategy Group
National Bank Financial Group

Teranet - National Bank House Price Index™ thanks the author for their special collaboration on this report.

1 Value of Dwelling for the Owner-occupied Non-farm, Non-reserve Private Dwellings of Canada.

Monday, December 1, 2008

Bull vs. Bear

Various versions of this chart have floated around for some time but I thought I'd post it here for discussion.


I think the conclusion you can draw from this chart is that the duration of bull markets is longer than the duration of bear markets. Additionally, bull markets nearly always rise higher than the previous bear market fell.
Keep in mind that a 50% fall requires a 100% increase to put you back at the same starting point. Additionally the chart is out of date because as of November 20th, 2008 the TSX had fallen 52% since June 18th, 2008.
When will things turnaround? I don't know, trying to time the market is for fools. Stocks are 'quite cheap' right now so I'm comfortable buying stocks because I have a long time horizon and a high risk tolerance. Perhaps the market will go down further but then stocks won't just be 'quite cheap', they'll be ridiculously cheap.
The advice of investing to your risk tolerance still stands.

Wednesday, July 16, 2008

Hindsight bias

From Wikipedia, the free encyclopedia

Hindsight bias is the inclination to see events that have occurred as more predictable than they in fact were before they took place. Hindsight bias has been demonstrated experimentally in a variety of settings, including politics, games and medicine. In psychological experiments of hindsight bias, subjects also tend to remember their predictions of future events as having been stronger than they actually were, in those cases where those predictions turn out correct.

Prophecy that is recorded after the fact is an example of hindsight bias, given its own rubric, as vaticinium ex eventu.

One explanation of the bias is the availability heuristic: the event that did occur is more salient in one's mind than the possible outcomes that did not.

It has been shown that examining possible alternatives may reduce the effects of this bias.

Classic studies

Paul Lazarsfeld (1949): Lazarsfeld gave participants interpretive statements that seemed like common sense immediately after they were read, but in reality the opposite was true.
Karl Teigen (1986): Teigen gave participants proverbs to evaluate. When participants were given the proverb "Fear is stronger than love", most students would rate it as true; when given its opposite ("Love is stronger than fear"), most would also rate that as true.

Phrases

The following common phrases are expressions or terms for hindsight bias:
- "I told you so!"
- "With the wisdom of hindsight."
- Retrospective foresight
- 20/20 Hindsight
- Monday morning quarterback

Friday, July 11, 2008

Is it time to buy stocks yet?

The major stock indices around the world have all come down a great deal in the past year and may be offering better investment opportunities now than 1 year ago.

I can't say whether stock prices will go up or down but as a student of market history I am interested in what the past can teach us. Have a look at this chart which tracks the Price to Earnings ratio of the 500 largest companies in the United States from 1950 to 2008. The index levels are significantly lower now and accordingly the P/E ratio is also lower now.


The US markets were down another 10% during June and more so far during July. Worry about the economy and the financial system is on every news channel and there are very few bright spots. Corporate earnings are expected to be under pressure over the next 12 to 24 months as it is likely that the US is in recession and the hangover from falling house prices bites into corporate profits. This will affect the 'E' part of the P/E ratio for the next while. Stock prices are also forward looking and are already pricing in the prospect of lower profits.

Personally, I have a long time horizon and I'm always buying as part of a systematic investment plan but I'm much happier buying today than 1 year ago.

Thursday, August 16, 2007

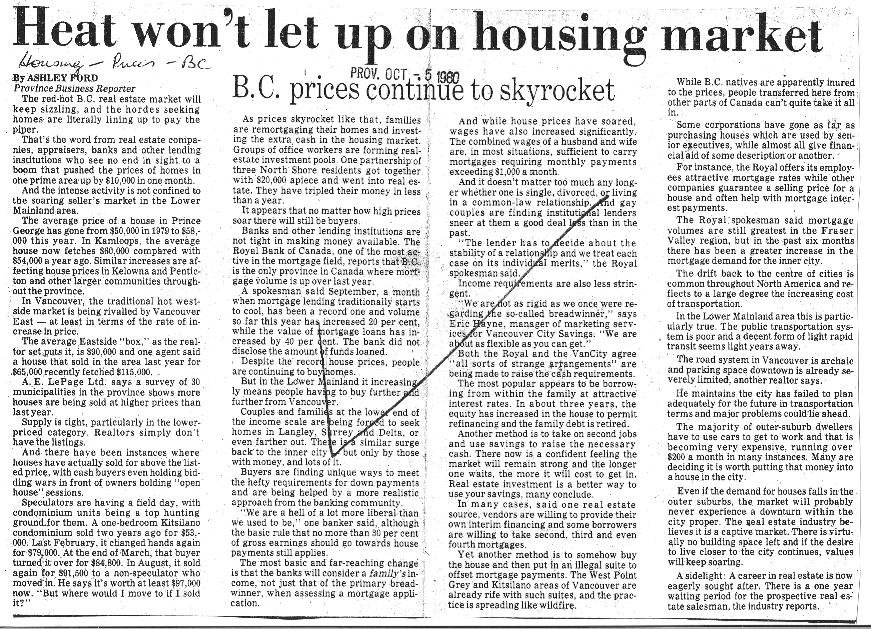
Name that date - VHB Archive - March 2006

"Even if the demand for houses falls in the outer suburbs, the market will probably never experience a downturn within the city proper. The real estate industry believes it is a captive market. There is virtually no building space left and if the desire to live closer to the city continues , values will keep soaring."

"Speculators are having a field day, with condominium units being a top hunting ground for them."

"It appears that no matter how high prices soar, there will still be buyers."

"We are a hell of a lot more liberal than we used to be" one banker said.

When were these things said? Let's try Oct 5th, 1980 in the Vancouver Province. (link)

Ok, let's try this one:

"While real estate prices have apparently reached a benchmark, there is no decline in house prices - and there won't be according to industry analysts."

"Look, there is a fact of life that people here are going to have to realize. If you want the fruits of living and working in a growing major cosmopolitain city, as everybody obviously does, there is a price to pay for it," an analyst said."Both agreed there is not a hope of prices falling and there is a terrific underlying strength to the market."

"The house prices have reached a temporary peak, simply because of the limitation of the purchasing power ..."

Let's try March 4th, 1981 in the Vancouver Province. (link)

Check the history - prices dropped by around 50% in 1981-82.

Now, we're in 2007 not 1981, so one should be careful in drawing conclusions. But it really is surprising how many of these quotes sound like the kind of things we hear today.